General Trends in the Municipal Bond Market
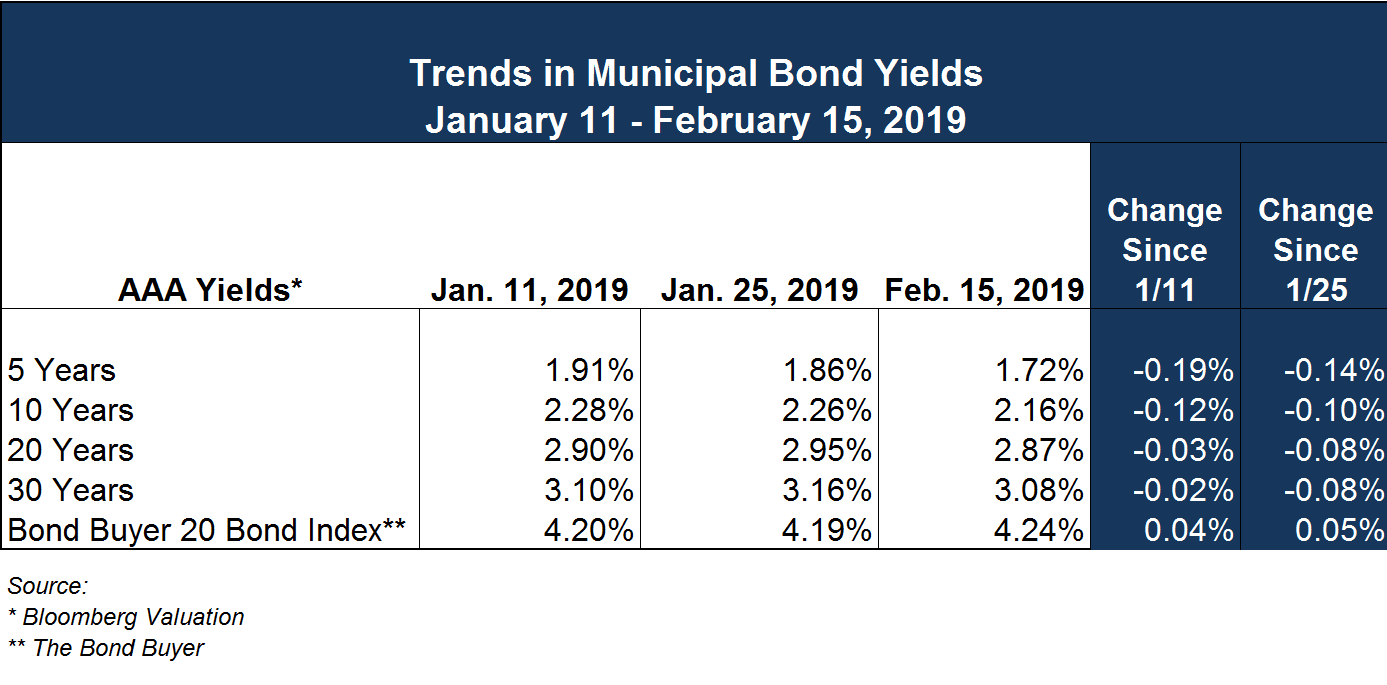
Treasuries are trading somewhat higher during a busy week of central bank updates. The yield on the benchmark 10-year note increased two basis points to 2.67% ahead of the January Federal Open Market Committee meeting minutes release today (see table below). Markets will also assess the minutes from the most recent European Central bank meeting on Thursday.

In all likelihood, the Fed will hold rates steady until something big happens in the economy, e.g. a significant change in inflation or some outsized economic growth – by the way, neither are likely to occur at this point in time. In the absence of either of those events, almost everything else that could happen would probably mean lower interest rates. For instance:
- Europe appears to be actively fighting against a recession, as indicated by the decline in the euro vs. the U.S. dollar and persistent negative yields on sovereign debt across the EU.
- Federal dysfunction and political gridlock continue in Washington with a politically divided Congress and a Presidential administration that has a hard time working with all of them.
- Then there is the U.S. economy, which is still growing albeit at a slower pace and is showing some signs of weakening with each piece of current data.
All in all, municipal bond yields are down slightly since our last Commentary, as shown in the table above. High demand for municipal bonds continues (and probably will continue) as inflation remains low and investors continue to seek tax-exempt income.
Social Impact Bonds
Shifting away from the markets for a moment, it seems many municipalities are struggling with rising rates of homelessness and mental health issues and are challenged to form adequate responses given limited public resources. For some communities, one solution has come in the form of social impact bonds (SIBS), which leverage private investment to finance such services so that governments do not have to front the cost of delivery. Investors are only paid if providers meet agreed upon outcomes – meaning, investors are rewarded for success and may lose their investment if those outcomes are not met.
Since their inception in 2010, SIBS have become somewhat popular. To date, at least 24 states and the District of Columbia have considered, are considering or are implementing SIB related projects. Of these, 11 states —Alaska, California, Colorado, Idaho, Maine, Maryland, Massachusetts, New Jersey, Oklahoma, Texas, and Utah — and the District of Columbia have enacted legislation. Legislative introductions and enactments range from establishing study committees to creating funds and supporting pilot projects.
How Do SIBs Work?
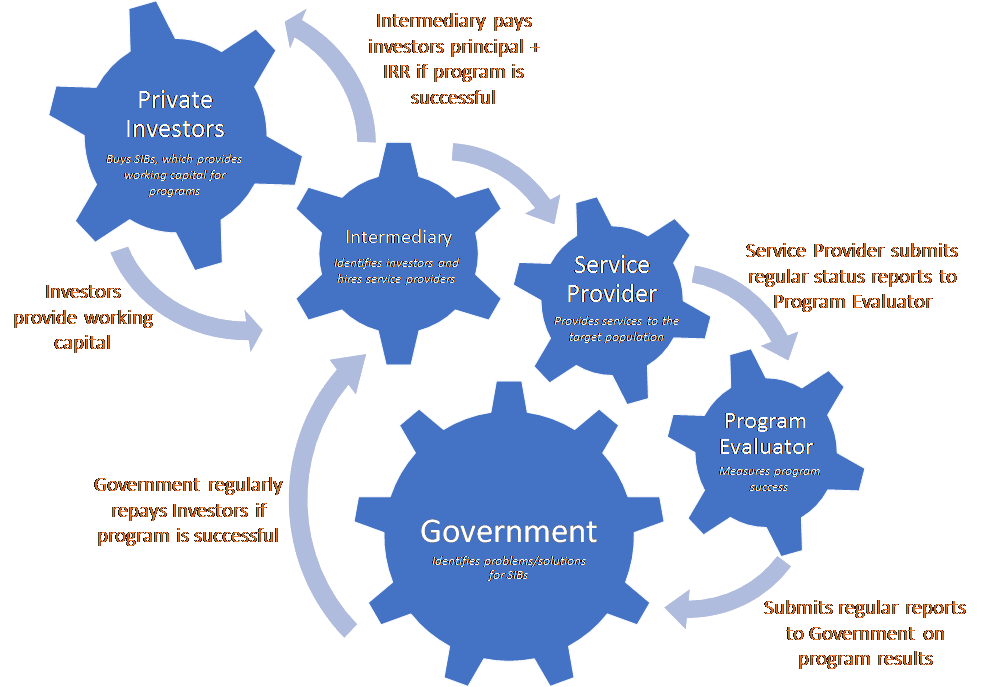
Similar to a public-private partnership, SIBs work by leveraging upfront private capital to accomplish a specific philanthropic objective. Private investors commit to pay for a program that they believe will lead to improved social results and public sector savings. The private investors are then repaid when contractually agreed upon objectives are achieved – the “pay for success” model.  The graphic below details how a typical SIB contract may be structured.
To date, SIBs have a mixed track record. For example, the Utah High Quality Preschool Initiative[1] SIB funded program has shown promising results—more than 700 low-income preschoolers have improved their school achievement and investors are getting paid back. In contrast, a SIB funded juvenile offender program in New York[2] did not reduce recidivism as intended. In the 2012 Rikers Island Adolescent Behavioral Learning Experience (ABLE) Project for Incarcerated Youth, the funding mechanism worked to shield government from risk. However, because the program did not produce the desired reduced rate of recidivism, the City did not have to repay investors and the program was terminated in 2015.
In short, SIBs are not a panacea for social welfare funding challenges. For governments to attract private investors and for the SIB agreement to be successful, proposed programs must demonstrate effectiveness at addressing the targeted social problems. Investors also need to know how much these programs will cost. Because these details must be known prior to executing a SIB contract, not all programs will be “ripe” for the SIB pay-for-success model. As such, at this early stage, SIBs are most appropriate for areas in which:
- Outcomes can be clearly defined and historical data are available;
- Preventive interventions exist that cost less to administer than remedial services;
- Interventions with high levels of evidence already exist; and
- Political will for traditional direct funding is difficult to sustain.
[1] https://hceconomics.uchicago.edu/sites/default/files/file_uploads/SIB-RBFFact_SheetUtahVersion.pdf
[2] https://www.payforsuccess.org/project/nyc-able-project-incarcerated-youth
Case Study: Denver, Colorado’s Permanent Supportive Housing
Like many other communities, the City and County of Denver (the “City”) faces limited resources to invest in existing preventive programs for the chronically homeless and individuals struggling with mental health and substance abuse challenges. Denver also has a high number of residents experiencing chronic homelessness compared with other U.S. cities. This number has steadily increased since 2012, putting the city in dire need of programs that can effectively target chronic homelessness. Too many of these individuals frequently interact with the police, jail, detox, and emergency care systems, all of which are extremely costly to taxpayers and have been proven in many cases to be ineffective because many also face persistent mental illness and substance abuse challenges.
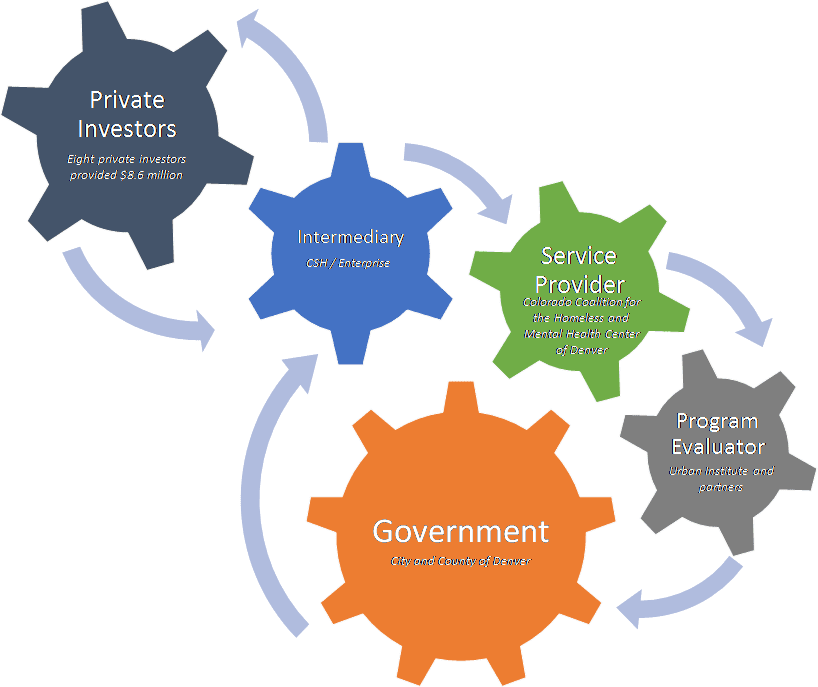
In February 2016, the City closed on an $8.6 million innovative SIB with eight private investors to fund a supportive housing program for 250 of Denver’s most frequent users of the criminal justice and healthcare systems;[1] the City previously estimated the individuals comprising this group spent an average of 59 nights in jail each year and frequently interacted with other services such as emergency care and detox, costing taxpayers upwards of $7.3 million on average per year. Supportive housing aims to stabilize people caught in a homelessness-jail cycle by combining permanent housing subsidies with wraparound intensive social welfare services aimed at helping this population gain increased stability in their lives. In Denver’s case, the idea was to first get people off the streets (Housing First), then help them tackle their other challenges. As such, Denver’s SIB program funding would be primarily to pay for services but could also be used as short-term rental subsidies while longer-term subsidies were explored; the program also pooled Medicaid and state and local housing resources to address that Housing First approach.
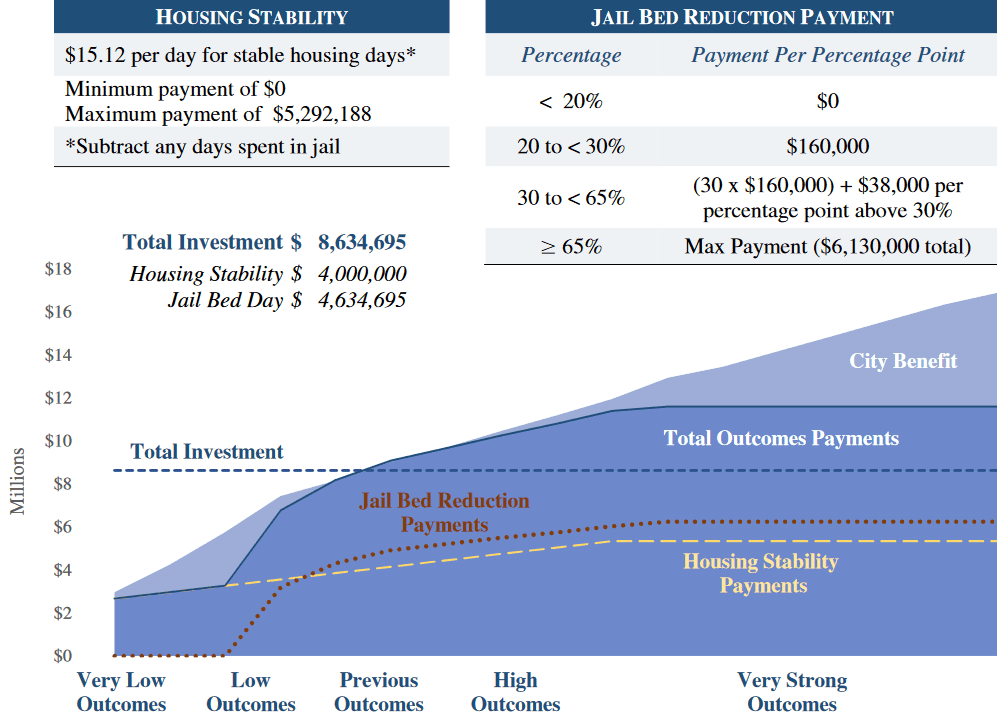
Under the agreement, Denver would only repay investors (with a positive return) over five years if its goals of housing stability and decreased jail days for this group of frequent users were met. If the program did not meet its goals, the City would not repay investors (also see the graphic above for the who’s who of Denver’s SIB and the excerpt below for how much the City has agreed to pay investors).
Success or Failure?
Since the project launch, the City’s service providers (the Colorado Coalition for the Homeless and the Mental Health Center of Denver) have enrolled 285 participants. In October 2017, the City made its first payment to investors of about $188,350 for outcomes achieved from January 1, 2016 to June 30, 2017. Investors also received a payment from the City for $837,618 for the period through June 30, 2018.
Investors were paid because housing stability goals were met – defined as those participants remaining in supportive housing for at least 365 days without any episodes away from housing for greater than 90 days or individuals who had a planned exit (e.g. death or moving to another form of housing) from housing at any point. As noted in line “C: Minus total days in jail during payment period,” the days housing participants spent in jail were subtracted from the total amount eligible for payments back to investors. Of the 136 participants who met the payment requirements, 60% had at least one jail stay during their time in housing and 40% did not have any. Most participants who had any jail stays during their time in housing had only one stay with an average of 32 days in jail and a median of 12 days in jail.
[1] https://www.enterprisecommunity.org/sites/default/files/2017-06/Denver-SIB-FactSheet.pdf
Progress Towards Meeting Goals
Early indications suggest Denver’s supportive housing SIB is promising. Participants are entering and remaining in housing, which is the primary indicator of the program’s success. From January 1, 2016 to June 30, 2018, 285 people experiencing chronic homelessness moved into the SIB’s supportive housing program. 85% of these participants remain in SIB housing and have not exited the program. 44 participants (14 of whom passed away) exited for various reasons, including lengthy jail stays.
After 18 months in housing, 40% of participants had not returned to jail and 60% had at least one jail stay. Although these numbers are still very high, the average number of days spent in jail is lower than that of the target population prior to participation in the SIB program. For reference, according to the City, in the first year after showing a pattern of 8 or more arrests over 3 years (the referral requirement for the SIB program), people in the target population spent an average of 77 days in jail in the few years leading up to their participation in the program. By comparison, those who have spent at least one year in SIB housing spent an average of 19 days in jail or have managed to stay out of jail completely.
Based on the SIB contract, the City repays investors who initially funded the project if predetermined housing stability outcomes are met. The Program Evaluator (The Urban Institutes) calculates 136 participants met the requirement of staying in housing for a year or having a justifiable exit, spending a combined 67,855 days in housing. As such, to date, investors have received $1,025,968 and the City has managed to help 136 of the 285 initially enrolled participants (about 48%) stay off the streets and out of jail for the most part.
Where to Use SIBs
As previously mentioned, SIBs are not a panacea, but they may provide a unique way to make effective interventions available to far more people in need than those reached through traditional state contracts and philanthropy. Most governments struggle with limited resources for prevention programs such as supportive housing and job training, which in turn may lead to greater demand for safety net services such as homeless shelters and prisons that are ineffective tools in dealing with the root causes. Because more limited resources must then be spent on the safety net programs, there is less money for early intervention or preventative programs, making it very hard for state and local governments to escape this vicious cycle.
SIBs were designed to accelerate the expansion of small-scale intervention programs and spur innovation and build knowledge of what works and what does not. As such, the SIB model allows local governments to award outcome-based contracts to a broader range of providers than they may have historically been able. Because any one of these organizations will need to raise working capital to fund the program until success payments arrive, if the service provider must raise this capital via their own balance sheet or through a bank loan, local governments’ pool of options is likely to be restricted to larger organizations. The SIB model allows for governments to partner with innovative and smaller mission-driven service providers to raise the up-front funding they need on terms that are more flexible than the standard bank loan without taking on the budgetary risk if the prevention program does not meet its objectives. As such, the best SIB partner candidates are nonprofits and other organizations with strong track records of improving outcomes for a well-defined target population, which can in turn lead to government savings in servicing the target population.
US Jobs Gain Despite Government Shutdown
The month-long partial government shutdown ended last week and thankfully everyone is back to work. However, despite the shutdown and furlough of nearly 800,000 government workers, the jobs report from the Labor Department released this month marked the 100th consecutive month of job gains, more than double the previous record. The hiring in the private sector was strong and broad-based, with manufacturers, retailers and construction companies all adding jobs. “This jobs report is showing no evidence of an economy slowing, certainly not falling into recession,” said Michelle Meyer, chief United States economist for Bank of America Merrill Lynch. “It’s still a tight labor market. Employers are still actively looking for jobs, and with wages ticking up, it looks like workers are getting some more bargaining power.”
The Labor Department’s jobs report does not mean that the economy escaped completely unscathed from the shutdown. The Congressional Budget Office estimates that the funding lapse shaved nearly $11 billion off total US output, $3 billion of which will never be recovered. But the effects on spending, investment and output will tend to show up later in future government reports, some of which were delayed by the shutdown.
Economists have become increasingly concerned in recent months about a range of possible threats to the United States economy. Growth has slowed in Europe and China; trade tensions are threatening the American manufacturing sector; stock market jitters could make consumers less likely to spend; and the shutdown, of course, could erode confidence among consumers and businesses. However, none of these headwinds have yet affected the job market.
Trends In Investment Returns

Ehlers’ Investment Advisors, with a combined 5 decades of experience, remain vigilant in monitoring current market conditions and in the development and implementation of investment strategies. Contact an Ehlers Investment Advisor today for assistance in evaluating your current investment portfolio and developing a strategy for consistent and predicable revenue.
IMPORTANT INFORMATION: PLEASE READ
The information contained herein reflects, as of the date hereof, the view of Ehlers & Associates, Inc. (or its applicable affiliate providing this publication) (“Ehlers”) and sources believed by Ehlers to be reliable. No representation or warranty is made concerning the accuracy of any data compiled herein. In addition, there can be no guarantee that any projection, forecast or opinion in these materials will be realized. Past performance is neither indicative of, nor a guarantee of, future results. The views expressed herein may change at any time subsequent to the date of publication hereof. These materials are provided for informational purposes only, and under no circumstances may any information contained herein be construed as “advice” within the meaning of Section 15B of the Securities and Exchange Act of 1934, or otherwise relied upon by you in determining a course of action in connection with any current or prospective undertakings relative to any municipal financial product or issuance of municipal securities. Ehlers does not provide tax, legal or accounting advice. You should, in considering these materials, discuss your financial circumstances and needs with professionals in those areas before making any decisions. Any information contained herein may not be construed as any sales or marketing materials in respect of, or an offer or solicitation of municipal advisory service provided by Ehlers, or any affiliate or agent thereof. References to specific issuances of municipal securities or municipal financial products are presented solely in the context of industry analysis and are not to be considered recommendations by Ehlers.
