Weakness in U.S. equity markets has continued early this week. Following Monday’s trading session, the S&P 500 was more than 6% below its record high last month. While the equities markets rebounded on Tuesday, ten-year Treasury yields fell to 1.71% as of Tuesday’s close of trading, the lowest level since 2016. As of Wednesday morning, ten-year treasury yields fell to 1.63%. President Trump’s comments late last week about additional tariffs on China, combined with signs the Federal Reserve wasn’t planning to lower rates as much as investors had expected were significant factors in driving Treasury yields downward.
The Federal Open Markets Committee (“FOMC”) lowered the target range for the federal funds rate to 2.00% – 2.25% last week, the first reduction in 11 years. But the ongoing factors that led to the reduction – largely worries about global disruptions and lackluster business spending – continue to dominate the economic landscape. Another rate cut could occur in September if these concerns are combined with further escalations to the trade war and a weakening labor market.
On that note, this week’s salvo in U.S. vs. China began Monday with China devaluing the yuan to its lowest level against the dollar in 11 years coupled with halting imports of U.S. agricultural products. As Bloomberg noted at one point during Monday’s trading session, the ten-year Treasury yielded 32 basis points (1 basis point equals .01%) less than three-month bills, the most extreme yield-curve inversion since the lead up to the 2008 crisis.
Moreover, a relatively positive jobs report last Friday did little to boost equity markets or temper expectations for another rate cut. Nonfarm payrolls rose by 164,000 in July, while the jobless rate held steady at 3.7%, near a 50-year low. However, job growth through the first seven months of the year has averaged 165,000 per month, below last year’s monthly average of 223,000. May and June payrolls were revised downward by 41,000. Average hourly earnings rose 8 cents to $27.98, pushing up the annual gain from 3.1% to 3.2%. The share of American adults working or looking for jobs ticked up to 63% from 62.9%, close to the highest levels of the past five years.
As previously stated, the ongoing trade concerns, an inverted yield curve and the state of global financial markets may continue to put pressure on the Fed to lower the fed funds rates again. Presently the CME FedWatch Tool projects the probability of the federal funds rate being lowered in September at 100%, with a roughly 86% chance of a quarter-point cut, up from 54% just last week.
Municipal Bond Yields Continue to Decline and Volume Surges
While the equity markets have been volatile over the past week, the news for municipal bond yields remains largely the same. Decreasing bond yields and pent up demand are an old refrain of late, but it is a winning combination for issuers. Bond yields have continued to decline over the past two weeks across the yield curve.
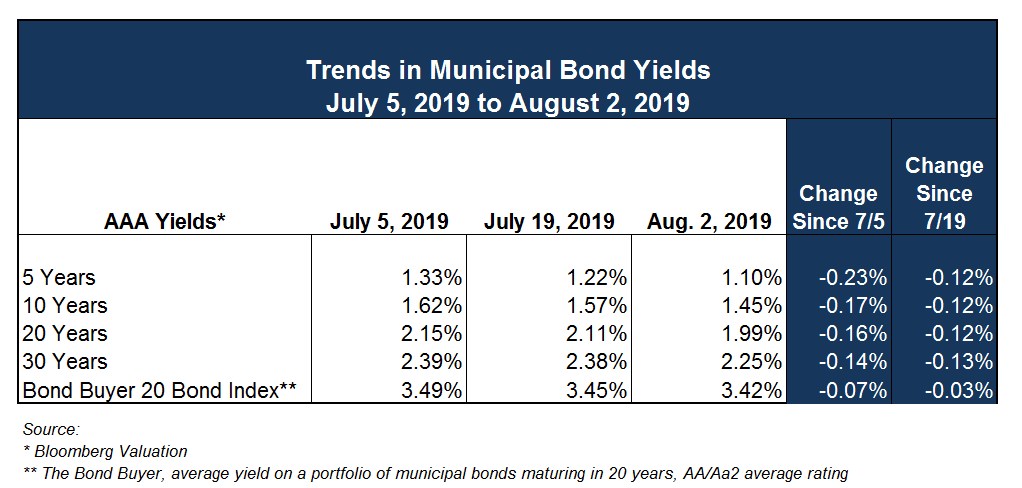
The Bond Buyer reports that this week is the first time in 2019 that muni bond issuance volume will exceed $10 billion, with an estimated volume of $12.6 billion. It will be the largest issuance week of 2019, with the previous high occurring the week of June 10 when volume was roughly $9.87 billion. The 30-day visible supply of new issues reached $16.9 billion on August 5th, the highest since December 2017. For 30 straight weeks, inflows into municipal bond funds have remained positive.
Demand for munis remains strong and while the uptick in volume will meet some pent-up demand, market conditions in general remain favorable for issuers. If these yield levels persist, we should anticipate refunding activity to pick up, which may include issuers advance refunding tax-exempt obligations with taxable debt, especially given favorable reinvestment opportunities for defeasance escrows.
IMPORTANT INFORMATION: PLEASE READ
The information contained herein reflects, as of the date hereof, the view of Ehlers & Associates, Inc. (or its applicable affiliate providing this publication) (“Ehlers”) and sources believed by Ehlers to be reliable. No representation or warranty is made concerning the accuracy of any data compiled herein. In addition, there can be no guarantee that any projection, forecast or opinion in these materials will be realized. Past performance is neither indicative of, nor a guarantee of, future results. The views expressed herein may change at any time subsequent to the date of publication hereof. These materials are provided for informational purposes only, and under no circumstances may any information contained herein be construed as “advice” within the meaning of Section 15B of the Securities and Exchange Act of 1934, or otherwise relied upon by you in determining a course of action in connection with any current or prospective undertakings relative to any municipal financial product or issuance of municipal securities. Ehlers does not provide tax, legal or accounting advice. You should, in considering these materials, discuss your financial circumstances and needs with professionals in those areas before making any decisions. Any information contained herein may not be construed as any sales or marketing materials in respect of, or an offer or solicitation of municipal advisory service provided by Ehlers, or any affiliate or agent thereof. References to specific issuances of municipal securities or municipal financial products are presented solely in the context of industry analysis and are not to be considered recommendations by Ehlers.