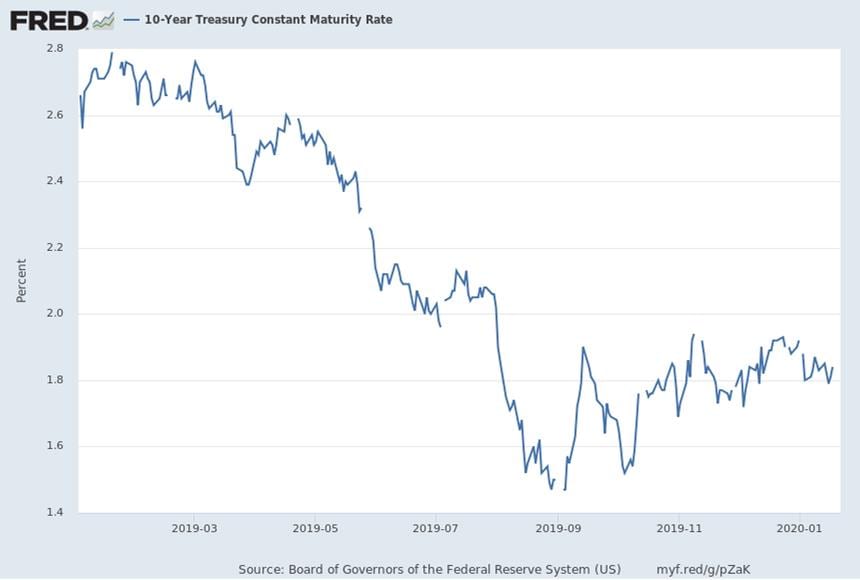
As we proceed into the final week of the first month of this new year (and decade), the general condition of interest rates would be best stated as stable. The benchmark U.S. Ten-year Treasury Note has moved gingerly within a range of about 1.75% – 1.90% during the last three months (as demonstrated in the chart below). At of the close of trading on Wednesday, January 22nd, the 10-year yield stood at 1.76%, and the weekly range over the last month was a trifling five basis points.
As investors position themselves for a new calendar year, the exit from the holiday-disrupted period for the financial markets is generally a quiet one. This quiet, however, is set against the din of world events. Notably, the U.S. Senate entered into the trial phase of the Presidential impeachment, which hasn’t stirred up more than a collective “yawn” from market participants. More importantly, the U.S. and China executed a “Phase I” trade agreement. While light on substance, the signing is perceived to have blown out the wick on what had been a powder keg of tariffs and bluster impacting the global economy for nearly the past two years. The hope is that this agreement leads to a broader framework between the two parties, normalizing trade relations and removing a major source of uncertainty for U.S. businesses. And perhaps even more importantly in recent days is the news surrounding an outbreak of a coronavirus in the Wuhan region of China, prompting the unprecedented containment of an 11 million person city in an effort to contain the spread. Due to recent history of another coronavirus – SARS – financial markets across the globe saw short “flight to safety” movement, bringing bond yields down and declines in equity markets. Should the situation worsen, we expect the trend in government bond yields to continue.
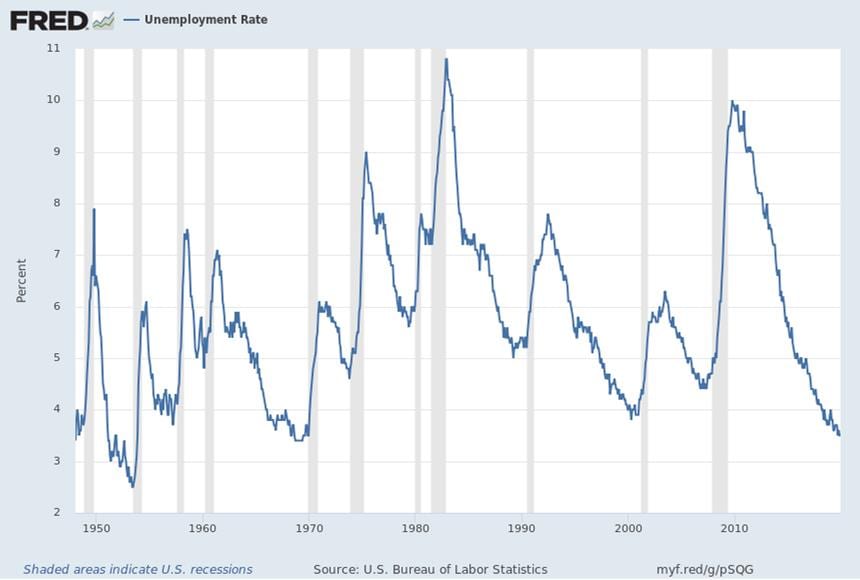
On the home front, jobs data in the U.S. has somewhat cooled with December nonfarm payrolls showing an increase of 145,000 jobs, trailing forecasts and down from a strong 250,000 jobs the prior month. Revisions have been material to these statistics in prior periods. Even with the degradation in trend, the unemployment rate stayed at 3.50%, still one of the lowest figures in the last 70 years and more or less indicating “full employment.”
There were no recent economic releases that would likely impact the points of view of Federal Open Market Committee (FOMC) members with respect to the target range for the fed funds rate. The current probability for a “no rate change” at the conclusion of next week’s FOMC policy meeting is nearly 90%, according to the CME’s FedWatch Tool. When reviewing probabilities based on fed funds futures pricing through the end of the calendar year, there is currently a slight bias toward one or two quarter-point cuts to the range during Q3.
Municipal Market
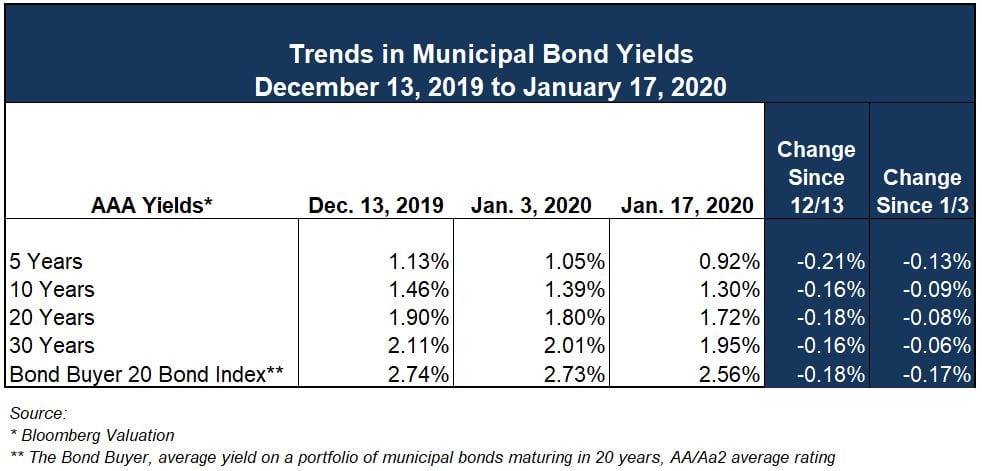
While the general state of interest rates is considered stable, the municipal market stands as a bit of an outlier. Munis have substantially outperformed treasury equivalents over the last month. While the yields on U.S. 10-year Note have been steady to trending down in the past four weeks, AAA yields, as quoted by Bloomberg Valuation, are down 15 to 20 basis points over the same period. The tax-exempt AAA/Treasury ratio at 10 years now stands at about 72%, at the end of the low point of its recent range (70%).
The story, as we’ve referred to in many of our prior Market Commentaries, is one of supply and demand, and actually, far more weighted toward demand. Supply increased in 2019 over the prior year, and there have been a number of recent weeks with large new issue volume. Nevertheless, buyers seem to have a voracious appetite.
On January 21st, The Bond Buyer quoted Pat Luby, senior municipal strategist at CreditSights as stating, “Over the past 10 weeks, the [ICE Bank of America Merrill Lynch] index has been down only once and that was the week ending December 10. The outperformance of the muni bond market pushed muni/taxable bond yield ratios to even richer levels.”
Other professionals have heeded some caution with the recent run-up in muni bond prices (note yields move inversely to prices).
In the same article Peter Block, managing director of credit and market strategy at Ramirez, states “Tax-exempts are ridiculously expensive based on several measures – ratios, spreads, absolute yields – all driven by chronic imbalance of supply/demand…”
Another driving force behind the increase in demand is related to the limitations on the SALT deduction, which is most acutely felt in high total tax jurisdictions. This has increased the value of tax-exempt income in these locales. At the highest tax rates (state and federal), even the current extremely low tax-exempt AAA yields are still better than taxable treasury equivalents at nearly every point on the interest rate curve. We don’t anticipate this dynamic to shift unless a seismic wave rolls through Washington D.C. in the 2020 elections.
Representative of this situation is last week’s multi-series offering of bonds by the City of Chicago of over $1.5 billion in total. Both transactions were heavily oversubscribed, with the G.O. (A/BBB+/BBB- – Moody’s rates the City Ba1) pricing at the tightest spreads to AAA yields in years.
Only time will tell if the current situation persists. In prior years, January has tended to have strong seasonality (lower yields), while April can be a period of weakness in the municipal markets as individuals liquidate investments to raise cash for tax payments. However, it’s more likely global events and U.S. economic data are the primary variables that will impact the municipal and broader interest rate markets over the near term.
It is undoubtedly a good time to be an issuer of debt. Your Ehlers advisory team can help you contemplate how to approach the market and structure your transaction to achieve preferred outcomes. As the winter ebbs and spring comes into bloom, we expect issuance in the markets we serve to pick up meaningfully. Talk with us now about planning for your capital needs.
IMPORTANT INFORMATION: PLEASE READ
The information contained herein reflects, as of the date hereof, the view of Ehlers & Associates, Inc. (or its applicable affiliate providing this publication) (“Ehlers”) and sources believed by Ehlers to be reliable. No representation or warranty is made concerning the accuracy of any data compiled herein. In addition, there can be no guarantee that any projection, forecast or opinion in these materials will be realized. Past performance is neither indicative of, nor a guarantee of, future results. The views expressed herein may change at any time subsequent to the date of publication hereof. These materials are provided for informational purposes only, and under no circumstances may any information contained herein be construed as “advice” within the meaning of Section 15B of the Securities and Exchange Act of 1934, or otherwise relied upon by you in determining a course of action in connection with any current or prospective undertakings relative to any municipal financial product or issuance of municipal securities. Ehlers does not provide tax, legal or accounting advice. You should, in considering these materials, discuss your financial circumstances and needs with professionals in those areas before making any decisions. Any information contained herein may not be construed as any sales or marketing materials in respect of, or an offer or solicitation of municipal advisory service provided by Ehlers, or any affiliate or agent thereof. References to specific issuances of municipal securities or municipal financial products are presented solely in the context of industry analysis and are not to be considered recommendations by Ehlers.