Last Friday, St. Louis Federal Reserve Bank President, James Bullard, mentioned that he believed the Fed’s first potential increase to the fed funds target rate would come in late 2022. This opinion is still considered to be in the minority of Fed leader’s thinking, according to the Summary of Economic Projections (SEP) from Wednesday June 16th. However, the data indicates there is growth in the contingent of Fed officials who prefer an interest rate increase earlier than the currently anticipated 2024. Bullard’s statements are seen to have contributed to a sharp selloff in equity markets, with the Dow Jones Industrial Average losing over 500 points on the day, or over 1.50%.
Additionally, the Federal Reserve’s Federal Open Market Committee (FOMC) last Wednesday stated it will continue to purchase $120 billion in U.S. Treasuries and agency mortgage-backed securities per month “until substantial further progress has been made toward the Committee’s maximum employment and price stability goals.”
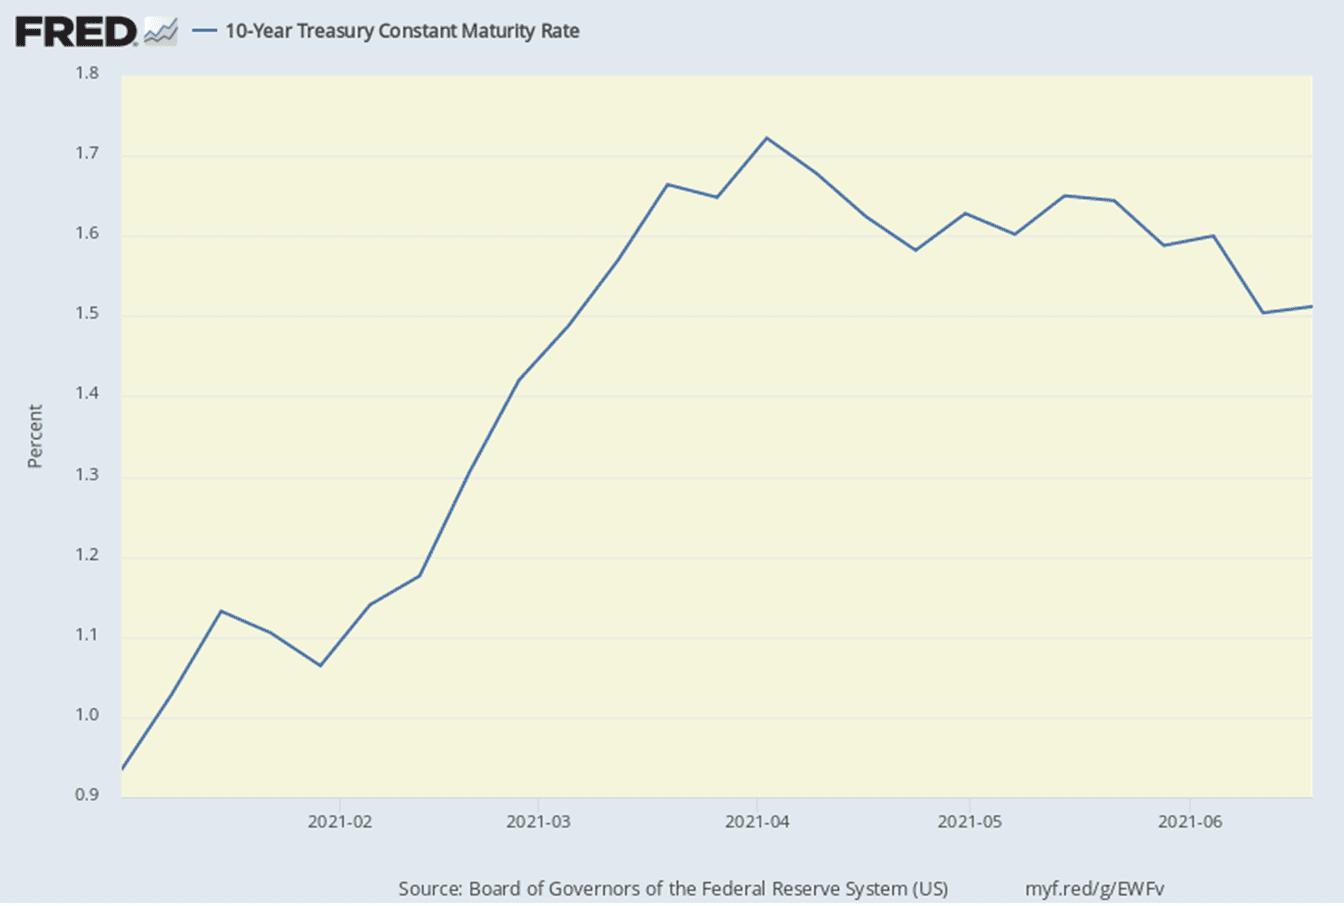
Though no timeline has been given for tapering the Fed’s bond purchases, just the mere mention of it during their monthly meeting suggests it is on the horizon – albeit a potential distant horizon. In fact, Fed Chairman Jerome Powell reported in his post-meeting press conference that this can be considered the meeting where they started “talking about tapering”. The market reacted to this statement predictably by selling off U.S. treasuries (especially on the long end of the curve). The following graph illustrates changes in the benchmark 10-year US Treasury yield. As equities markets have continued to run hot, and data show the economy has emerged from a Covid-19 related slump, treasury yields have priced in inflation and expected rate increases on the longer end of the curve. However, the increases in intermediate and long-term yields were short-lived, as the 10- and 30-year benchmark Treasury both finished lower on the week and have remained near those lows into this week.
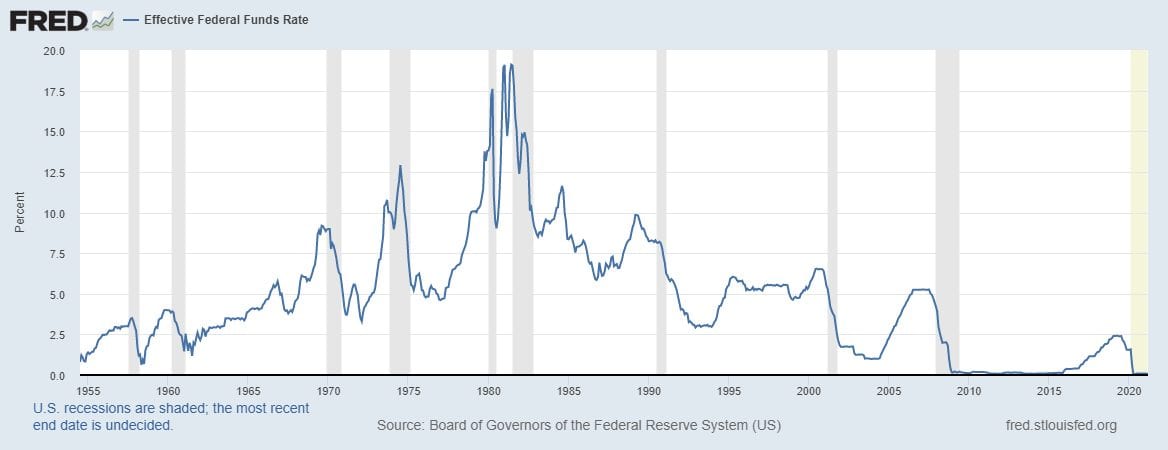
U.S. financial markets will undoubtedly continue to vacillate, as investors await key data on inflation (June CPI is due out July 13th), employment and growth. Forthcoming inflation, unemployment and jobs numbers will likely be the deciding data points for the Fed as they look ahead to a potential shift in the target Federal Funds range for the first time since March 2020, when the FOMC decreased the range effectively to 0% in response to the Coronavirus pandemic’s economic impacts. The chart below shows the history of the fed funds effective rate and how it intersects with periods of economic recession (gray bars).
Trends in Municipal Yields
Summer officially began this week. But, based on the recent weather in much of the continental United States it feels like we are already deep into the dog days. Similarly, municipal bond investors are feeling the beckoning of summer, and fewer secondary market trades mean very little movement for municipal yields this week.
During the past week, U.S. Treasuries have outperformed the AAA MMD curve (Municipal Market Data according to Refinitiv). Muni-Treasury (M/T) ratios at the 2-, 5-, 10- and 30-year maturities were up roughly 12%, 6%, 5% and 5% (to 62.9%, 56.3%, 64.5% and 68.7%), respectively over the past week. However, key maturities are still trading at ratios that are well below their 12-month averages (The Bond Buyer).
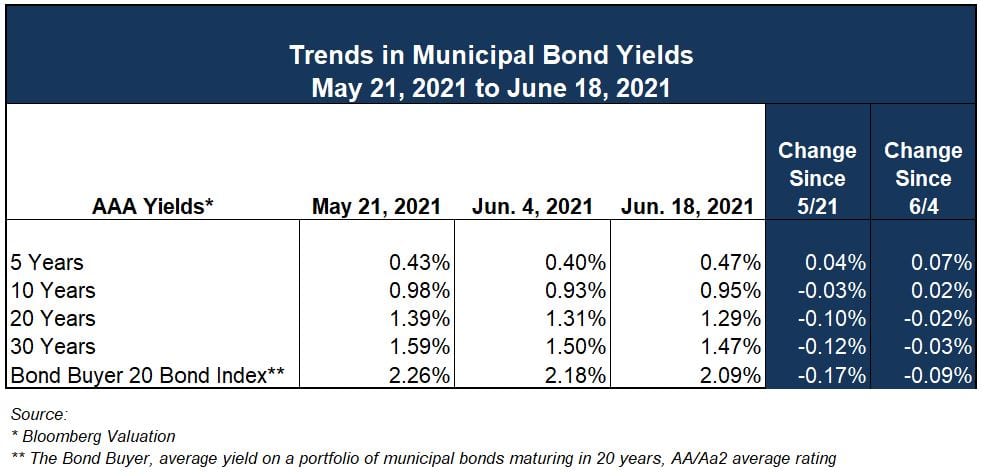
Municipal yields have remained mostly level going back to mid-May. This run of stability, has been very advantageous for municipal issuers, especially in light of all that has changed in the broader U.S. markets since Covid-19 impacts began easing.
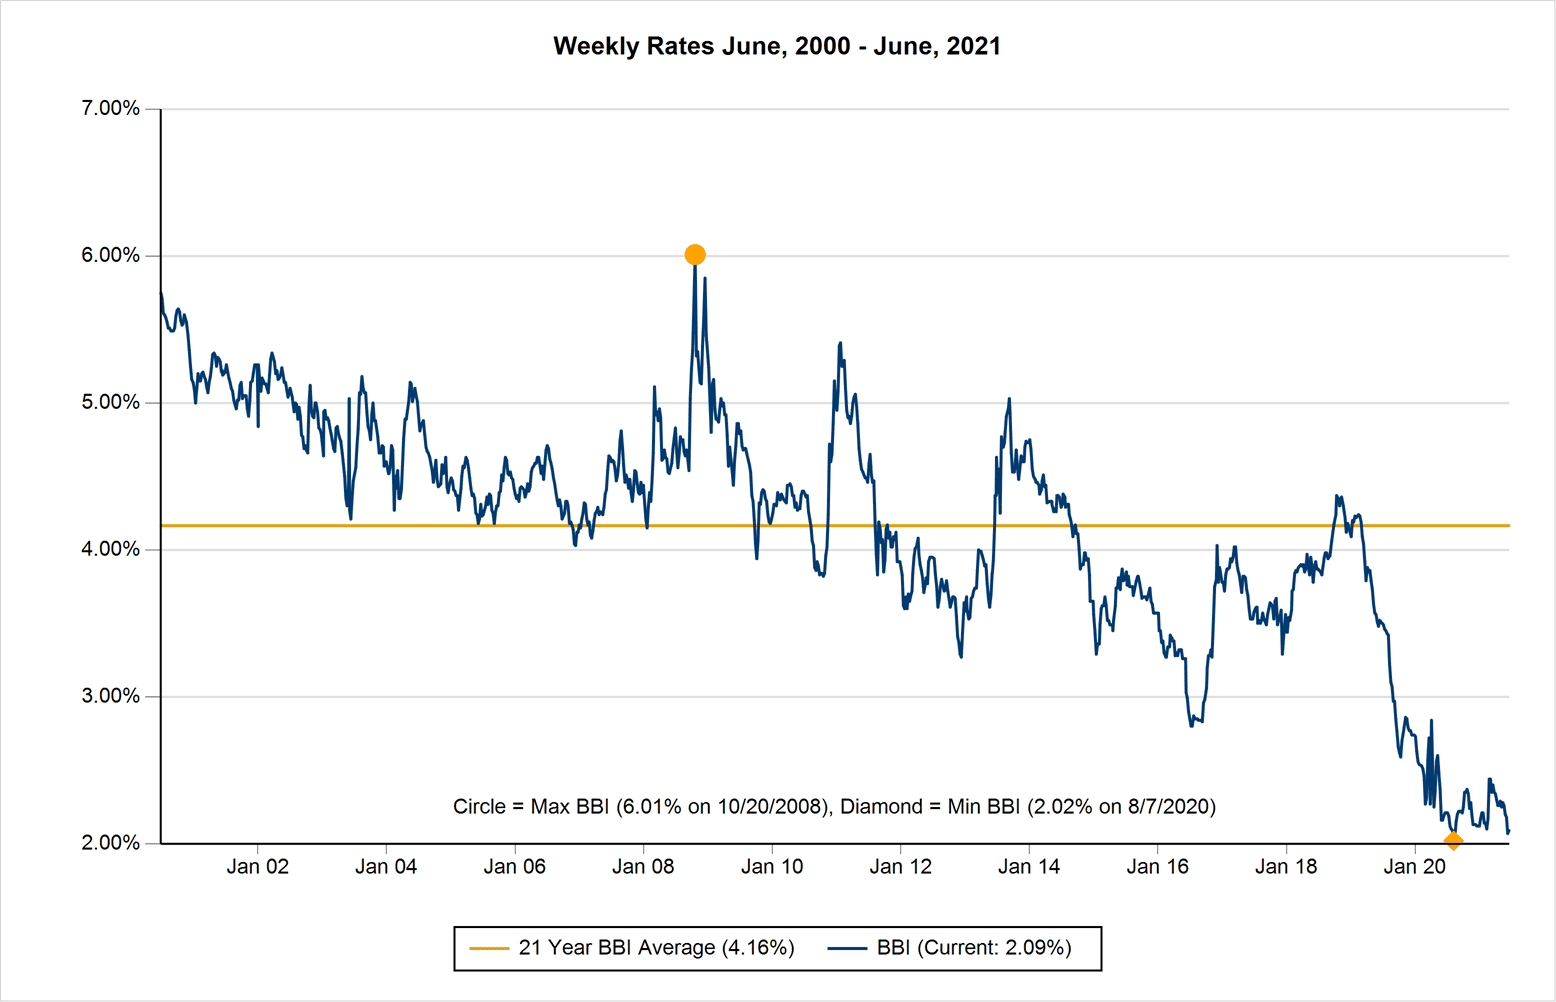
The rate environment continues to be historically low, and though there is talk of increases in 2022 or 2024 related to Fed actions, the long run of low interest rates has helped communities to invest in themselves at historically low cost. For those interested in broader context, the following graphs show the 2000-2020 municipal issuance totals and the Bond Buyer Index (BBI) interest rate for the same period, which represents the average rate for a portfolio of tax-exempt (non-BQ) municipal bonds with a maturity of 20 years and rating of “AA”.
The first graph shows municipal bond issuance (split by security type) since 2000. As municipal bond interest rates declined in the early 2000’s, as indicated by the second graph, issuance of all types has increased. Then in the period during and after the Great Recession, issuance flattens and even recedes slightly. However, as rates have continued to decline during the mid-2010’s and into the Covid-19 era issuance has increased significantly to where it is today at just short of half a trillion dollars, annually.
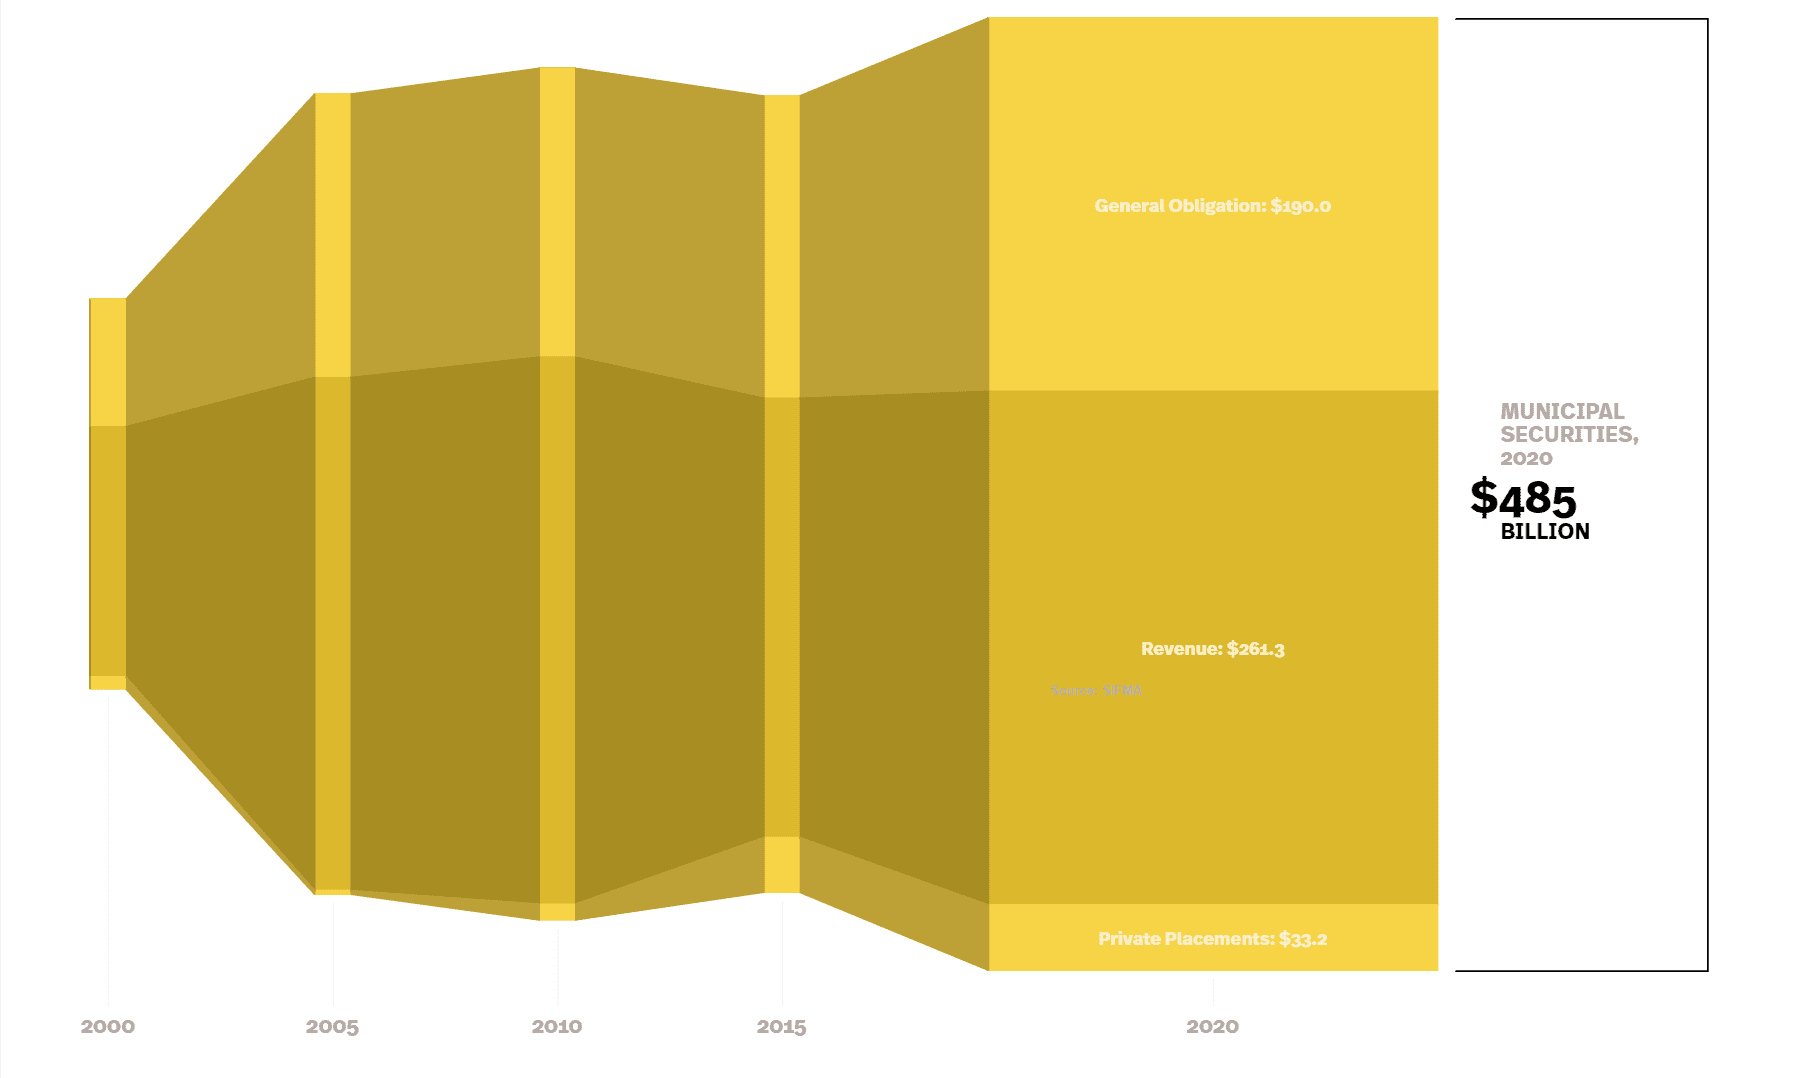
Source: SIFMA
Required Disclosures: Please Read
Ehlers is the joint marketing name of the following affiliated businesses (collectively, the “Affiliates”): Ehlers & Associates, Inc. (“EA”), a municipal advisor registered with the Municipal Securities Rulemaking Board (“MSRB”) and the Securities and Exchange Commission (“SEC”); Ehlers Investment Partners, LLC (“EIP”), an investment adviser registered with the SEC; and Bond Trust Services Corporation (“BTS”), holder of a limited banking charter issued by the State of Minnesota.
This communication does not constitute an offer or solicitation for the purchase or sale of any investment (including without limitation, any municipal financial product, municipal security, or other security) or agreement with respect to any investment strategy or program. This communication is offered without charge to clients, friends, and prospective clients of the Affiliates as a source of general information about the services Ehlers provides. This communication is neither advice nor a recommendation by any Affiliate to any person with respect to any municipal financial product, municipal security, or other security, as such terms are defined pursuant to Section 15B of the Exchange Act of 1934 and rules of the MSRB. This communication does not constitute investment advice by any Affiliate that purports to meet the objectives or needs of any person pursuant to the Investment Advisers Act of 1940 or applicable state law. In providing this information, The Affiliates are not acting as an advisor to you and do not owe you a fiduciary duty pursuant to Section 15B of the Securities Exchange Act of 1934. You should discuss the information contained herein with any and all internal or external advisors and experts you deem appropriate before acting on the information.