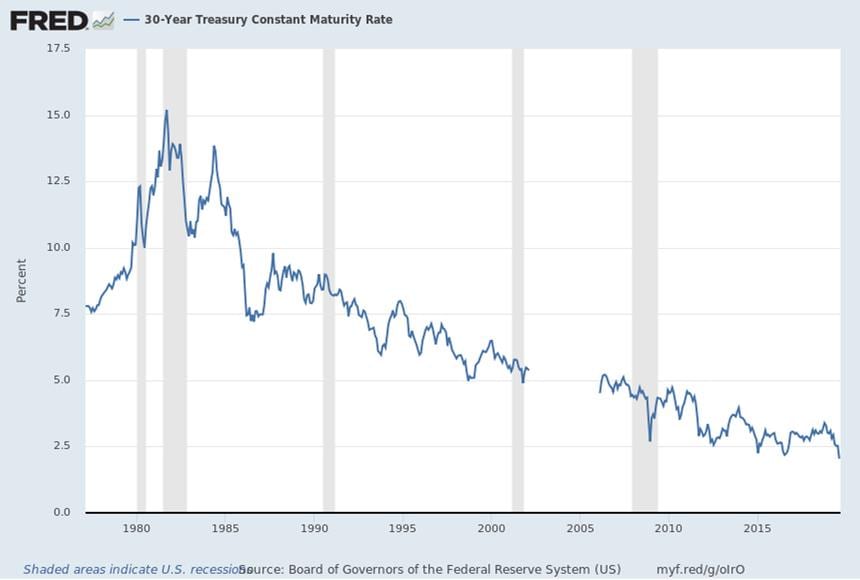
While the U.S. has not yet entered the universe of negative yields now attached to nearly $17 trillion (yes, trillion) in sovereign and corporate debt around the globe, we are undoubtedly inching closer with each passing month. The U.S. Treasury first issued 30-year bonds in the late 1970’s, with a brief interruption in the early 2000’s when federal deficits were meager. These bonds initially carried yields of about 7.50% at their introduction, rising to a peak of just over 15.00% in the early 1980’s. It’s been downhill from there, and earlier this month the 30-year Treasury reached its lowest level ever of just under 2.00%. Meaning, the nominal return on the “long-bond” is now roughly equivalent to the recent rate of inflation, effectively providing zero real yield to an investor.
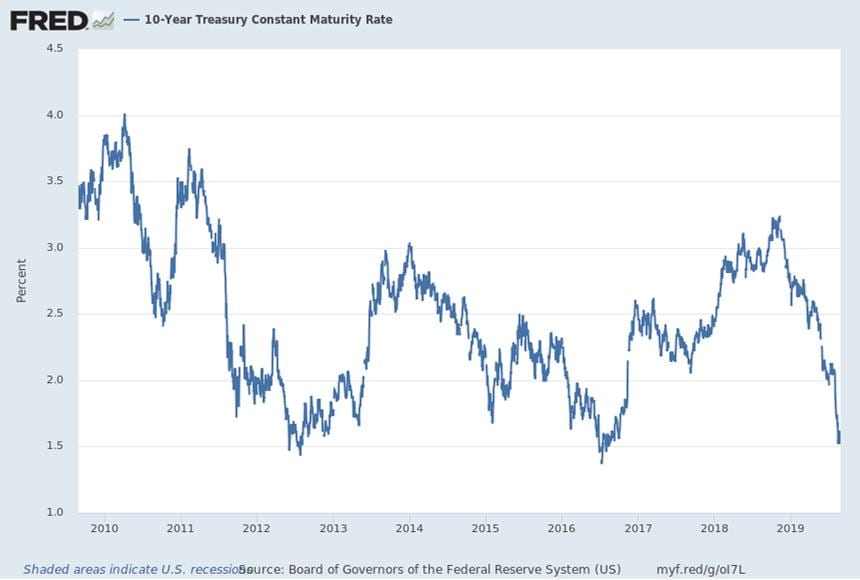
U.S Treasury yields with terms ranging from 2- to 10-years have all hovered around 1.40% – 1.50% these past two weeks and all the points on the interest rate curve are roughly 100 basis points (or more) less than they were at the start of 2019. Most of the decline in yields has come in the last 60 days, as has been noted in our prior Market Commentaries. The highest-yielding part of the curve is now the 1- to 3-month spectrum with yields of 2.05% (1 mo.) to 2.00% (3 mo.), where Federal Reserve policy with respect to the fed funds rate dominates. The fed funds rate is now higher than every other point on the U.S. Treasury benchmark curve and the U.S. 10-year is bouncing around lows established in 2012 and 2016.
The state of affairs here on our shores stands in contrast to other global bond markets. Take Germany, for example, where all yields along the sovereign spectrum out to 30-years are now negative. U.K. government bond yields are less than 1.00% through 30-years. In Japan, short-term yields are negative and the 30-year government bond yields 0.159%. Austria’s 100-year bond yields just over 0.70%. There was even news of a Danish bank offering negative rate 10-year, fixed-rate mortgages, recently!
Wimpy will be glad to pay you tomorrow for a hamburger, today – – it will just be less than what the burger costs today.
There is tremendous uncertainty across the world with respect to economic and monetary conditions, which seems to have recently escalated vis a vis the U.S./China trade dispute. Just last week, President Trump responded forcefully to a Chinese announcement regarding the imposition of and increases to tariffs on U.S. goods by threatening to increase U.S. tariffs on Chinese goods from 25% to 30% on $250 billion on October 1 and an increase from 10% – 15% on another $300 billion of goods on September 1. U.S. equity markets cringed on the news, falling nearly 3% with a 600+ point drop in the Dow Jones Industrial Average. The S&P 500 is still up over 15% for the year, though it is down almost 5% since the end of July.
While the Federal Reserve has generally avoided explicitly viewing global economic circumstances as a matter that should be addressed through U.S. monetary policy, recent conditions and comments seem to imply policy-makers can no longer avoid the gravity of the mass around us. Chair Powell, at last week’s Jackson Hole Symposium hosted by the Federal Reserve, offered some fairly benign comments, but alluded to the fact that conditions leading to the July fed funds rate cut have persisted or even increased. Indeed, economic data through the first half of the year has been uneven. Employment data remains steady, albeit lackluster, at this stage of the economic expansion. Consumer confidence, as reported by the Conference Board, posted no significant change in August from the prior month, although the expectations component of the index declined month-over-month. Durable goods data for July was released last week, showing a 2.1% increase for July (up slightly from June), although some of the core components (e.g. orders) showed drops that may portend slowing growth for the next half of the year. Lastly, some of the regional Federal Reserve Bank surveys have been mixed, with Texas and Richmond indicating positive signs in manufacturing and services, while Chicago showed some deterioration in key measures.
It’s clear the Fed can no longer ignore the various market signals manifesting themselves in the mosaic of interest rate expectations both here and abroad. If it does, the broader market will see it as “tone deaf” to the conditions around it, which may result in a lack of confidence. The CME’s FedWatch Tool indicates a nearly 96% probability of a quarter-point fed funds rate cut (to a range of 1.75% – 2.00%) at the conclusion of the September 18 Federal Open Market Committee (FOMC) meeting. The probability has been running close to 100% the previous two weeks. The probability of another quarter-point cut at the October meeting is approximately 57%. Even with 50 basis points of easing to the fed funds rate, the curve would essentially be flat through 10+ years, assuming rates remain unchanged from present levels. Lost a bit in the mix of U.S. monetary policy is the continued, planned decline in reinvestment of the cash flows from the Federal Reserve’s bond portfolio. The Fed has been reducing its reinvestment by $50 billion a month, until reaching a steady state in September of this year, at which point its balance sheet will be roughly $3.5 trillion (from a peak of approximately $4.25 trillion). This has been a sort of stealth “tightening” embedded in the Fed’s policy framework, although it hasn’t seemed to matter much to longer-term yields.
Impacts on the Municipal Market
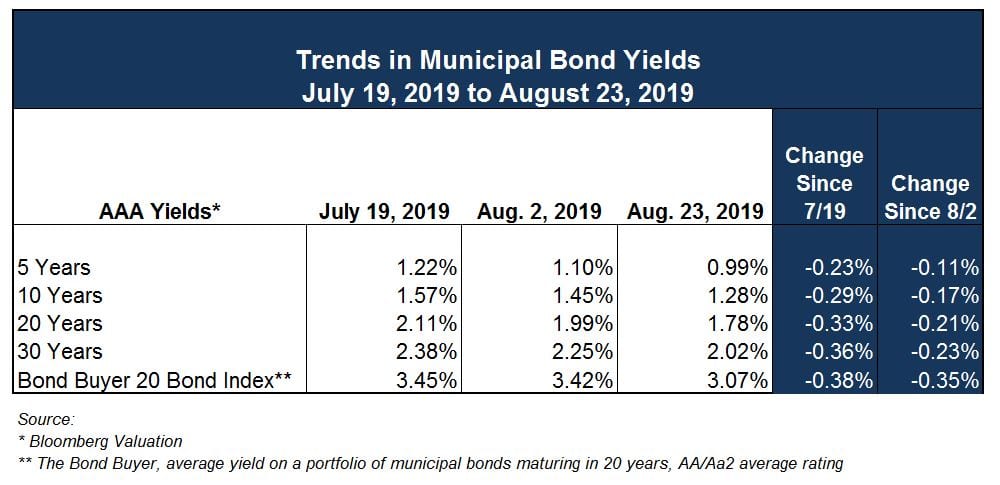
Tax-exempt yields have enjoyed the downward draft provided by U.S. Treasuries. However, Treasury yields have declined slightly faster than tax-exempt counterparts at similar maturities these last couple weeks. This has resulted in tax-exempt to taxable yield ratios increasing marginally. For instance, the ratio at 10-years has exceeded 80% for the first time in many months. In any case, the absolute levels of municipal yields have reached all-time lows at a number of benchmark spots on the interest rate curve with both 10- and 30-year MMD AAA yields printing record lows on August 28 at 1.21% and 1.83%, respectively. Tax-exempt yields have declined from about 25 to 35 basis points in the last month, according to Bloomberg Valuation services.
New-issue volume has been relatively steady at $5 billion – $7 billion per week, with a handful of weeks at or above $10 billion. Lipper reports that net flows for tax-exempt bond funds have been positive for 33 consecutive weeks, standing at over $43 billion year-to-date. This final week of August will see roughly $6 billion in new issuance.
Taxable transactions have recently increased in popularity with investors, with anecdotes of over-subscription on a number of larger transactions. The Bond Buyer reported the State of Massachusetts’ (AA1/AA/AA+) priced a taxable transaction on Monday that double in size from $440 million to $858 million due to “robust investor demand”. Taxable bonds currently represent a viable option to effect advance refundings for economic savings. Direct bank placements can also be executed on a tax-exempt basis with forward settlements to achieve a current refunding for call dates up to one-year out at nominal premiums to spot rates due to “flatness” of the yield curve.
A number of factors germane to the economic and interest rate discussion above have also boiled over into the municipal market from a credit perspective. The U.S. v China trade battle has undoubtedly had a negative impact on the agricultural sector, most acutely on crops such as soybeans. Moody’s Investors Service released a Sector In-Depth report on the impacts of the trade war on ag-related credit. The report specifically cites the impact to soybean-producing areas/states, including Illinois, Iowa and Minnesota, as well as shipping ports on the Western seaboard. Additionally, state and local pensions will return to focus (as if they can be focused on even more) given low levels of interest rates, stock market volatility and the general impact of economic uncertainty. Absolute returns in pension funds for states with fiscal years ending June 30 will most likely look strong, with positive return attributions for both stocks and bonds. The positive returns from bonds will be in the form of price appreciation. Clearly, these pension plans don’t intend to liquidate their collective bond holdings to capture this increase in market value. Any bonds maturing will be replaced with lower-yielding securities. Furthermore, there may be another shoe to drop if return expectations need to be adjusted downwards to reflect current conditions, which would cause actuarial contribution levels to increase to retain plan funding status. We’ll see how the rating agencies collectively view the framework of credit conditions as state audits and pension results for FY 19 are released in the coming months.
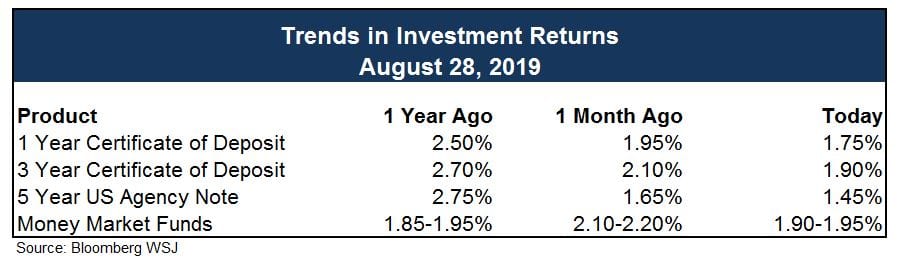
Investment Trends Section
 With the release of the minutes for the July 30-31 meeting, the market got some added insight into what Fed members were thinking. Recall that 2 Fed Presidents cast dissenting votes at the July meeting, saying they preferred to see the target range for the fed funds rate left unchanged at 2.25% to 2.50%. What was notable at the July meeting was the indication that more than one voting member wanted a 50-basis point rate cut. Per usual, the language of the minutes leaves room for interpretation, yet they could be seen as dovish since all but two voting members argued for a rate cut of some kind, particularly because concerns about trade tension and slower global growth were compounded after the meeting was concluded.
President Trump hasn’t been shy with his criticism of Fed Chair Powell and his leadership. It boils down to a desire by the president for lower rates and perhaps a return to quantitative easing. Other Fed critics side with the President, maybe not so much in terms of the scope of policy easing, but they may agree with the view that the Fed erred in their decision to raise the fed funds rate in December. Still, others support what the Fed did in December, as well as its flexibility in taking back that rate hike with a rate cut in July (the first cut since 2008). A definitive assessment can only be made in the future, yet it’s indisputable that the U.S. economy is continuing with its longest expansion on record despite nine rate hikes between December 2015 and December 2018. Growth could be stronger, however, the reasons why it isn’t are an ongoing source of debate. Indeed, various factors, ranging from demographics to trade policy, provide ready material for differing viewpoints.
The Fed is sensitive to market expectations and it typically doesn’t want to surprise the market with a policy decision, but the fed funds futures market has been the Fed’s best informant. Currently, the fed funds futures market is suggesting another rate-cut in September. If the Fed leaves the target range for the fed funds rate unchanged, there could be some knee-jerk selling in the Treasury market.
Ehlers Investment Partners does not believe in timing investments as interest rates fluctuate. With a comprehensive cash flow forecast as a guide Ehlers Investments believes a laddered portfolio structure, with an average weighted maturity not to exceed 3 years, will meet or exceed all the investment objectives as outlined in an investment policy. Additionally, a laddered structure will allow for taking advantage of rising interest rates as maturing investments will be reinvested at higher rates and falling rates will not have a significant impact on overall portfolio performance.
IMPORTANT INFORMATION: PLEASE READ
The information contained herein reflects, as of the date hereof, the view of Ehlers & Associates, Inc. (or its applicable affiliate providing this publication) (“Ehlers”) and sources believed by Ehlers to be reliable. No representation or warranty is made concerning the accuracy of any data compiled herein. In addition, there can be no guarantee that any projection, forecast or opinion in these materials will be realized. Past performance is neither indicative of, nor a guarantee of, future results. The views expressed herein may change at any time subsequent to the date of publication hereof. These materials are provided for informational purposes only, and under no circumstances may any information contained herein be construed as “advice” within the meaning of Section 15B of the Securities and Exchange Act of 1934, or otherwise relied upon by you in determining a course of action in connection with any current or prospective undertakings relative to any municipal financial product or issuance of municipal securities. Ehlers does not provide tax, legal or accounting advice. You should, in considering these materials, discuss your financial circumstances and needs with professionals in those areas before making any decisions. Any information contained herein may not be construed as any sales or marketing materials in respect of, or an offer or solicitation of municipal advisory service provided by Ehlers, or any affiliate or agent thereof. References to specific issuances of municipal securities or municipal financial products are presented solely in the context of industry analysis and are not to be considered recommendations by Ehlers.