INVERSION DIVERSION
It is one of the most ominous terms used in economic parlance. A word that can send shivers up the spine of even the most cold-blooded Wall Street trader. This expression describes an occasion where long-term government bond yields fall below that of shorter maturities. This relatively rare phenomenon is known as “Inversion”. Nearly immediately following Federal Reserve Chair Jerome Powell’s press conference upon conclusion of the Federal Open Market Committee meeting on March 20, U.S. Treasuries rallied (prices increased) with yields along the entire interest rate curve falling fairly dramatically.
One of the most closely watched interest rate relationships in the market is the spread between the 3-month T-bill and 10-year Note. The 10-year Note traded at a yield nearly 10 basis points (0.10%) less than the 3-month T-bill in the days after Chair Powell’s press conference. This is the first occurrence of the 10-year yield falling below the 3-month yield since September of 2007. This also marked a fifteen-month low for the 10-year Note, at 2.37%. Yield curve inversion has preceded every U.S. recession in the past 50 years, with only one false signal during that time. However, a better indicator of recessionary expectations is both the magnitude and duration of such an inversion. In fact, this inversion quickly remedied itself in the weeks that followed, with the 10-year Note reverting to a positive yield spread of about 10 – 15 basis points in recent days. Additionally, prior periods of inversion, leading up to recession were coincident with a Federal Reserve that continued its path of fed funds rate increases into the face of such conditions. It seems starkly clear this Fed has no present intention of following the same trajectory. There are some that believe the relationship between the 2-year and 10-year Notes provides a better outlook on future economic conditions. The spread between the two (10’s less 2’s) has not shifted into negative territory.
The broader trend for U.S. interest rates during the month of March has been positive for issuers, with Treasuries lower in yield (higher in price) nearly across the entire term spectrum. Yields from two to ten years have fallen approximately 20 basis points since the beginning of March, although the last week has seen a rebound of about 10 basis points in these intermediate maturities. The graph below shows the changes in the U.S. Treasury interest rate curve from the beginning of March trading through April 3. The bar chart at the bottom depicts the magnitude of change (in basis points) at each interval (3/4 vs. 3/18 & 3/18 vs. 4/3).
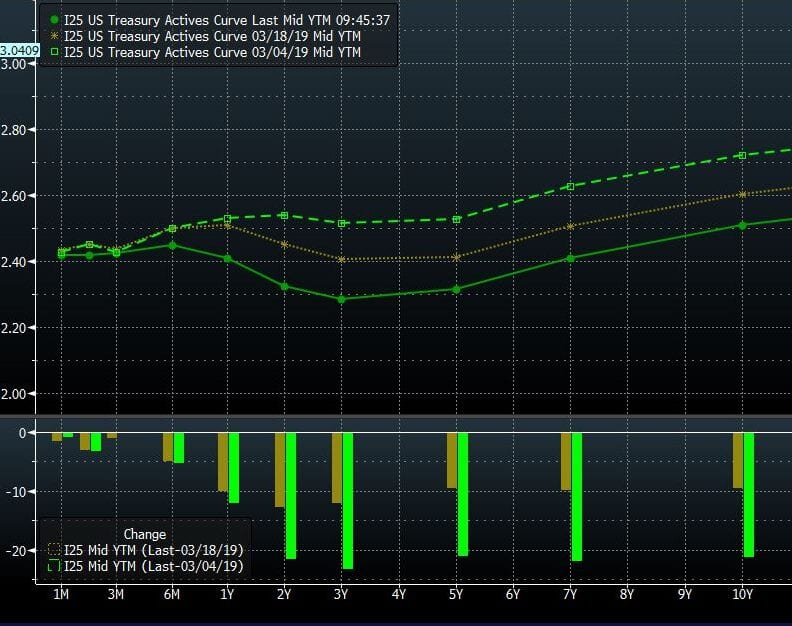
Source: Bloomberg
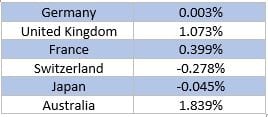
The recent decline in U.S. interest rates seems to be a result of several factors. Economic data has been middling, at best, domestically, and perhaps viewed more negatively globally (especially Europe). Both the European Central Bank and Bank of Japan have expressed that they intend to continue monetary policy accommodation well beyond periods where the markets were anticipating pull back from these efforts. Global government bond yields are moribund, with some longer maturities having briefly dipped into negative territory. 10-year yields for major economies are currently:
The recent comments and data from Fed officials released upon conclusion of the March FOMC meeting clearly gave a sign to the market that the Fed is in no rush to further tighten monetary policy. While the fed funds futures market has for quite some time priced in zero probability of additional increases to the fed funds rate this calendar year, the Fed all but confirmed this with its various forward-looking metrics. Fed estimates of GDP and inflation for the year were also lowered. As we have previously observed, the probability of a rate cut this year has grown since January.
MUNICIPAL BONDS
The municipal market has been a beneficiary of the trend of increases in government bond prices, with yields declining significantly across the term spectrum, although most pronounced in intermediate and long-term maturities.
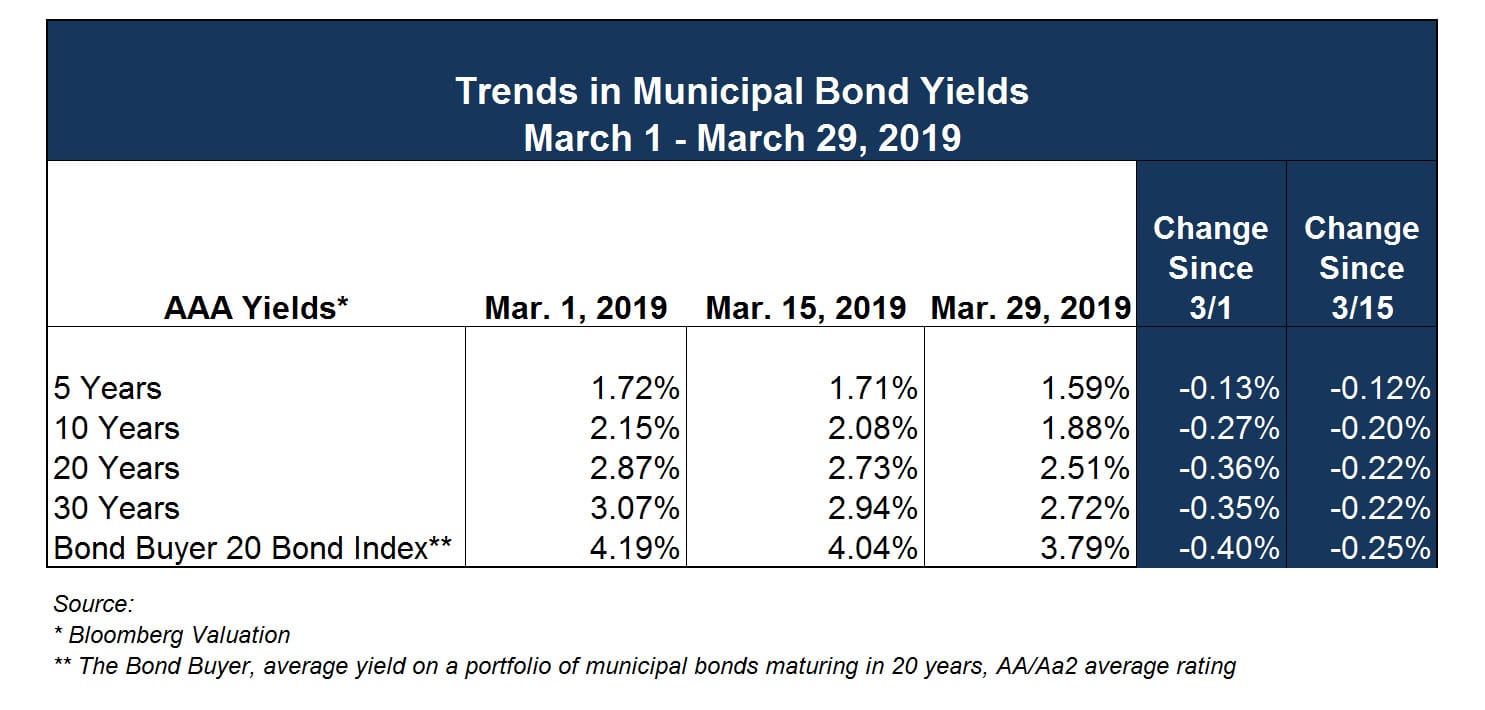
Municipal yields have generally outperformed U.S. Treasuries during this favorable period with ratios of tax-exempt to taxable yields at some of their lowest reported levels in nearly a decade. The 10-year AAA yield, as reported by Bloomberg, stands at approximately 77% of the comparable term Treasury Note.
As we have previously noted in our Market Commentary, a favorable supply-demand profile has proved a boon to municipal issuers. The Bond Buyer reports that new issue volume was up over 14% year-over-year for the first quarter of 2019, but down 7% in March 2019 vs. 2018. The March 29 edition of The Bond Buyer quotes John Carney, head of municipal strategy at BlackRock as stating, “We have seen record demand from ISI [Investment Company Institute] data this year and it will remain robust for the remainder of the year.”
Many muni market observers see the potential for a trend that would result in “net-negative” supply for the market over the next quarter, where redemptions will exceed the volume of new bonds issued. Lipper reports positive net mutual fund flows every month this calendar year.
Without a serious disruption or exogenous event impacting the financial markets, the next few months could prove to be a very hospitable environment for issuers looking to lock-in fixed rate financing for upcoming projects. Additionally, reinvestment options are far more optimal than they have been in many years. Your Ehlers advisory team can assist in mapping out a complete strategy to take advantage of these conditions, as we enter construction season.
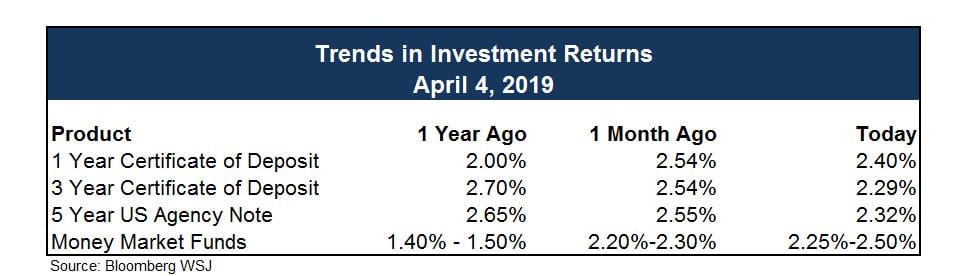
INVESTMENT TRENDS
The Federal Reserve said in early January that it will be patient with its policy approach. New context was provided recently as to just how patient the Fed is inclined to be. Specifically, the updated “dot plot” comprised of Federal Open Market Committee (FOMC) forecasts of the fed funds rate calls for zero (!) rate hikes in 2019 versus two rate hikes at the time of the December 2018 meeting. In turn, the Fed is only projecting one rate hike for 2020. The Fed’s median projection for the change in real GDP was also downgraded to 2.1% (from 2.3%) for 2019 and to 1.9% (from 2.0%) for 2020. That is all subject to change based upon incoming data, yet the knee-jerk buying interest in the stock market was understandable because the policy action at the March meeting made it clear that the market doesn’t have to live in fear of the Fed like it did in the fourth quarter.
There may, however, be burgeoning concerns that any further pivot to a dovish Fed mindset reflects a diminished view of the global economic outlook that won’t translate well for earnings growth. That could be a fight for a different day, because the stock market loves low interest rates, and interest rates came down noticeably across the yield curve in the wake of the latest announcement. The 2-yr U.S. Treasury yield fell from 2.55% on March 1 to 2.27% on March 31, and the 10-yr yield dropped from 2.76% to 2.41%, only 2 basis points above a new low for the year.
Fed Chair Powell isn’t overly concerned by the flattening yield curve — even if U.S. banks are — having said in his press conference that the Federal Reserve thinks the policy rate and the U.S. economy are in a good place. Furthermore, he indicated the data the Federal Reserve are currently seeing aren’t pushing it in any direction in terms of making a change to the policy rate. That’s why the Federal Reserve is committed to being patient to see what future data reveal. The revelation coming out of the March FOMC meeting, though, is that the Fed is clearly embracing a dovish mindset for now, having voted unanimously to leave the target range for the fed funds rate unchanged at 2.25% – 2.50%, reducing its 2019 interest rate projection from two hikes to none, and announcing a plan to end its balance sheet runoff at the end of September 2019.
IMPORTANT INFORMATION: PLEASE READ
The information contained herein reflects, as of the date hereof, the view of Ehlers & Associates, Inc. (or its applicable affiliate providing this publication) (“Ehlers”) and sources believed by Ehlers to be reliable. No representation or warranty is made concerning the accuracy of any data compiled herein. In addition, there can be no guarantee that any projection, forecast or opinion in these materials will be realized. Past performance is neither indicative of, nor a guarantee of, future results. The views expressed herein may change at any time subsequent to the date of publication hereof. These materials are provided for informational purposes only, and under no circumstances may any information contained herein be construed as “advice” within the meaning of Section 15B of the Securities and Exchange Act of 1934, or otherwise relied upon by you in determining a course of action in connection with any current or prospective undertakings relative to any municipal financial product or issuance of municipal securities. Ehlers does not provide tax, legal or accounting advice. You should, in considering these materials, discuss your financial circumstances and needs with professionals in those areas before making any decisions. Any information contained herein may not be construed as any sales or marketing materials in respect of, or an offer or solicitation of municipal advisory service provided by Ehlers, or any affiliate or agent thereof. References to specific issuances of municipal securities or municipal financial products are presented solely in the context of industry analysis and are not to be considered recommendations by Ehlers.