The Federal Reserve has been cautious about making any note of potentially transitioning its stance on monetary stimulus until it is clear the economy has recovered to at least pre-pandemic levels. In his April 28 statement following the most recent Federal Open Market Committee (FOMC) meeting, Fed Chair Jerome Powell said the recovery “remains uneven and far from complete.” Those qualms seemed to be confirmed last week with the unexpectedly underwhelming jobs report.
Prior to last week’s indicators for the month of April, there was anticipation that we were off to a spring economic boom that would continue into the summer. Some forecasters’ expectations were that one million new jobs would be created, and some set their expectations even higher. However, the shock of the underwhelming jobs report put an abrupt halt to that optimism. Actual numbers came in incredibly low at 266,000 new jobs added in April. Below are some interesting facts about that number:
- Leisure and hospitality posted more new jobs in March. This could serve as an indication that demand is returning to the sector that was hit hardest by the pandemic[1].
- Net job growth went to men; women as a group lost jobs [2].
- The U.S. economy remained 8.2 million payrolls short of pre-pandemic levels from February 2020[3].
- The number could be adjusted upward after raw data are revised.
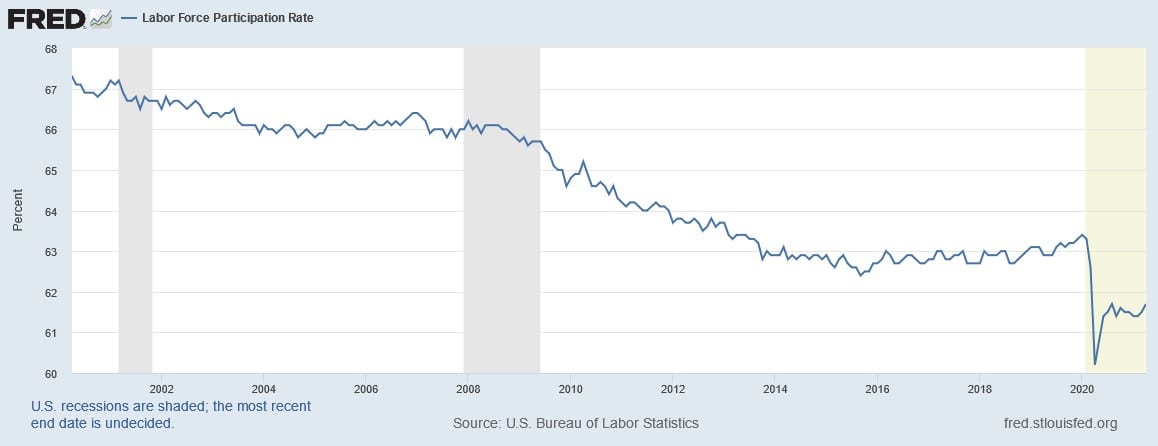
The labor force participation rate is another indicator to look to in evaluating the economic recovery. This indicator is a measure of an economy’s active workforce – it is the ratio of all workers employed or actively seeking employment divided by the total working-age population.

At first glance, the labor force participation rate increase to 61.7% from 61.5% seems trivial, but prior to the pandemic, the rate was 63.6% (February 2020). Though not back to the pre-pandemic levels, the tick upward is notable. With more workers looking for employment combined with April’s low jobs report, it follows suit that the unemployment rate followed in tandem with the aforementioned indicators and increased slightly to 6.1%. Market observers had anticipated the unemployment rate would move downwards from 6% to 5.8%.
Among the reasons cited for the lower than expected jobs numbers include fear of getting or spreading COVID-19; workers hesitation to take lower paying jobs; enhanced unemployment benefits being more valuable than available compensation in the workforce; and, schools still operating remotely, leaving parents without childcare. [4] Likely in an attempt to keep his recovery and spending proposals moving forward, President Biden opted to focus not on the lower than anticipated statistics but instead on the fact that the economy has millions of fewer jobs than when the pandemic began. The economy is still missing about 8.2 million jobs that previously existed before the crisis, not to mention the 2 million jobs that would have likely been created had the pandemic never happened. It may take a year or two to get them all back. [5]
In short, employment indicators are presently running contrary to the “substantial further progress” that the Fed would likely need to see to move away from its policy of holding the fed funds rate near zero and continuing to buy about $80 billion of Treasuries and $40 billion of agency mortgage-backed securities each month.
Inflation Concerns or Not
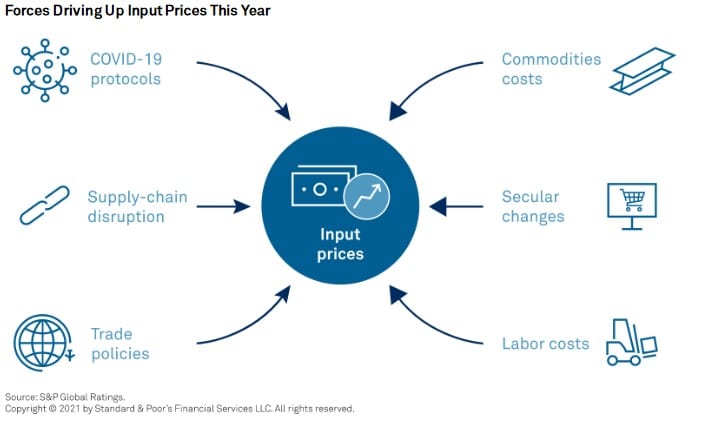
Inflation has many facets, but perhaps the most tangible are increases in the costs of raw materials and transportation to produce and deliver finished consumer products. To illustrate this, below is a graphic from S&P Global[6] explaining the causes of increases in the costs of inputs as per their corporate sector survey, which seems to confirm the Fed’s narrative that current price increases are transitory and don’t represent inflation, at least in the near term. The arbiter of truth in this regard will be time.

When not passed along to the consumer, industries can manage rising prices through cost-saving strategies or productivity gains. However, tariffs and trade tensions, demand and pandemic related changes can trickle down to profit margins and/or consumer prices.
That said, inflation is also a mathematical calculation. In his recent “Face the Nation” interview Neel Kashkari, President of the Minneapolis Fed, reminded viewers that inflation is calculated on a rolling 12 month basis, so “just based on math, we know the inflation numbers are going to look high in the next few months [Because this time last year, the inflation numbers plummeted].” As economic indicators are announced, this is a good reminder that any year-over-year measure at this point is relative to data points established during the pandemic-induced shutdowns that were in place this time last year.
Indeed, this has borne itself out with Wednesday’s release of CPI data, showing an annual increase in consumer prices of 4.2% and 0.8% from the prior month. This is against expectations of 3.6% annually and 0.2% increase month-over-month. Also anticipated this week are measures of retail sales from the Census Bureau, consumer confidence as determined by the University of Michigan’s survey of consumer sentiment, and the weekly jobless claims.
The Effect on the Muni Market
Though we are all anxious to see how quickly the recovery will happen (if you recall, the labor market recovery following the 2008 recession took 10 years), the municipal market held steady with demand for tax-exempt debt still outpacing supply. Inflation can affect the municipal bond market, but as for the aforementioned indicators, the only direct linkage is that the probability of a large sell-off induced by higher rates in the near term has probably declined somewhat after [Friday’s] payrolls – as noted by a Barclays strategist.[7] It remains to be seen how the market will absorb today’s inflation news, as it’s no secret to anyone with a pulse that prices have been rising for nearly all goods and services.
The muni market is a good option for investors that are looking for higher returns coupled with lower taxes especially in light of the proposed tax hikes by the Biden administration, including an increase to the capital gains tax. In a recent note, Bank of America analysts stated the municipal market is entering “a new golden decade of strong growth and strengthening credit quality.”[8] At the start of the pandemic, the concern that the credit quality of municipal issuers would drop as state and local revenues plummeted, but over the last year, state and local revenues have rebounded, muni credit quality has shown resilience and on the whole munis have provided returns to investors that outpaced Treasuries and corporate paper. There are certainly segments of the municipal market that do remain revenue-impaired and are under stress.
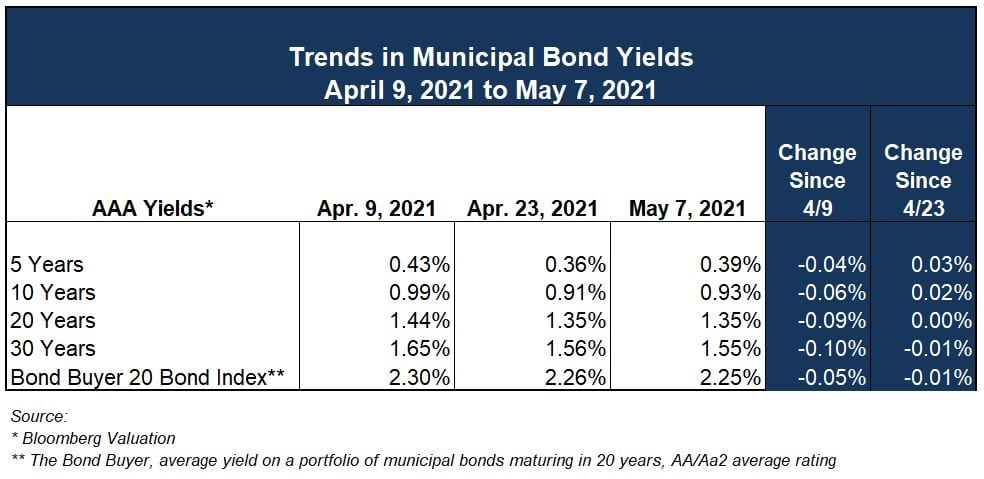
As shown in the table below, “AAA” yields (as reported by Bloomberg Valuation) decreased 4 to 10 basis points across the maturity spectrum from April 9 to May 7, with little variation between shorter and longer maturities. Over the past year though, muni rates have come down, for the week ending May 8, 2020 (this same time last year), “AAA” yields from 5 – 30 years ranged from 0.82% to 2.03%.

At the beginning of May last year, the ratio of the 10-year AAA muni yield to the 10-year treasury yield was at 156.1%. This week, the ratio of the 10-year AAA muni yield to the 10-year treasury yield was 63%, according to Refinitiv MMD. The ratio is a helpful comparison of the two yields that have historically tended to move in unison, but for periods where significant tax law changes or market disruptions have occurred. At the start of the pandemic this ratio was over 200% as investors sold off even the most credit-worthy munis, preferring instead the safety of Treasury securities.
Investors usually find more new issue supply in May as we head into the summer construction months, but last week started off slow [when compared to prior years] for the month of May. Municipal bond sales scheduled for this week are down considerably from last week’s sales. The Bond Buyer reports that there were $9.916 billion of deals last week versus $3.467 billion on the calendar for this week.
If you are contemplating the issuance of debt for an upcoming project or for refinancing, keep in mind that it is certainly a good time to be an issuer of debt. Contact a member of your Ehlers advisory team to assist you in planning for your borrowing needs.
[1] https://www.bondbuyer.com/news/another-week-of-sub-par-volume-to-keep-rates-low
[2] https://apnews.com/article/lifestyle-coronavirus-pandemic-health-business-82aa4f9fddcea22918d010c55b5e55b3
[3] https://finance.yahoo.com/news/april-2021-jobs-report-payrolls-labor-department-unemployment-181552009.html
[4] https://www.wsj.com/articles/april-jobs-report-unemployment-rate-2021-11620332156
[5] https://www.marketwatch.com/story/u-s-gains-disappointing-266-000-jobs-in-april-but-all-signs-still-point-to-faster-hiring-in-months-ahead-11620391689?mod=mw_latestnews
[6] https://www.spglobal.com/_assets/documents/ratings/research/100051767.pdf
[7] https://www.bondbuyer.com/news/another-week-of-sub-par-volume-to-keep-rates-low
[8] https://www.wsj.com/articles/demand-for-municipal-bonds-lowers-borrowers-costs-11620572580
Required Disclosures: Please Read
Ehlers is the joint marketing name of the following affiliated businesses (collectively, the “Affiliates”): Ehlers & Associates, Inc. (“EA”), a municipal advisor registered with the Municipal Securities Rulemaking Board (“MSRB”) and the Securities and Exchange Commission (“SEC”); Ehlers Investment Partners, LLC (“EIP”), an investment adviser registered with the SEC; and Bond Trust Services Corporation (“BTS”), holder of a limited banking charter issued by the State of Minnesota.
This communication does not constitute an offer or solicitation for the purchase or sale of any investment (including without limitation, any municipal financial product, municipal security, or other security) or agreement with respect to any investment strategy or program. This communication is offered without charge to clients, friends, and prospective clients of the Affiliates as a source of general information about the services Ehlers provides. This communication is neither advice nor a recommendation by any Affiliate to any person with respect to any municipal financial product, municipal security, or other security, as such terms are defined pursuant to Section 15B of the Exchange Act of 1934 and rules of the MSRB. This communication does not constitute investment advice by any Affiliate that purports to meet the objectives or needs of any person pursuant to the Investment Advisers Act of 1940 or applicable state law. In providing this information, The Affiliates are not acting as an advisor to you and do not owe you a fiduciary duty pursuant to Section 15B of the Securities Exchange Act of 1934. You should discuss the information contained herein with any and all internal or external advisors and experts you deem appropriate before acting on the information.
