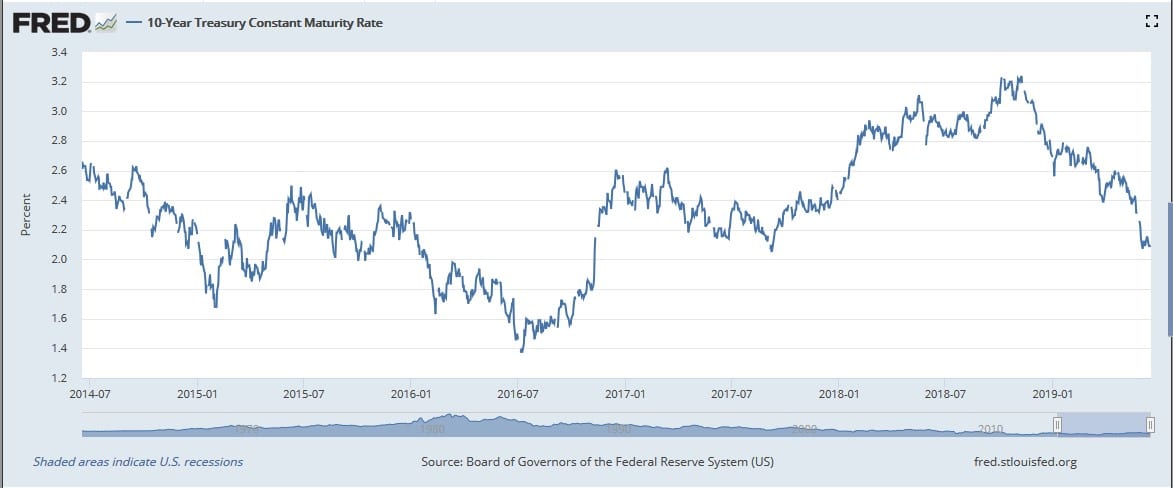
For nearly the last two months fixed-income market participants have witnessed intermediate and long-term yields across the globe collapse to lows not seen in a number of years. Benchmark U.S. Treasury yields at 10- and 30-years have fallen roughly 50 basis points since early April (1 basis point = 0.01%), and nearly 100 basis points since their recent respective peaks in November of 2018. Yields at 2- and 5- years have fallen even more during this time. The 10-year German “bund” has precipitously fallen back into negative yield territory, with investors paying for the privilege of owning the securities with a yield of -0.32%, surpassing the previous nadir in 2016. The U.K. “gilt” yields about 0.80% and the Japanese 10-year yielding -0.12%, although not reaching its previous low around -0.30% in 2016.
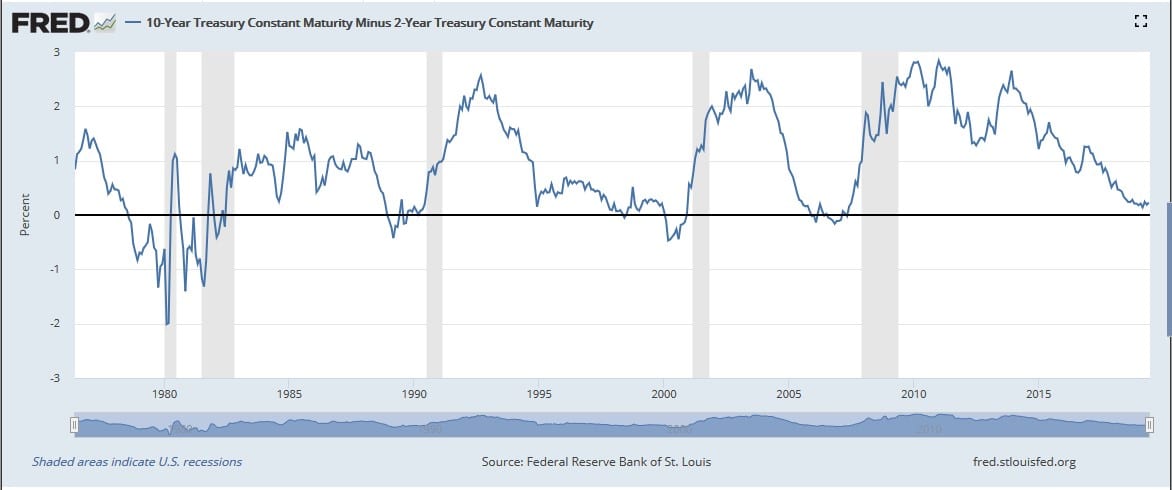
The factors impacting market sentiment are broad and well documented. Trade conflicts, global tensions, an economic expansion that is long-in-the-tooth and showing signs of exhaustion. Just this week, several economic data points have disappointed. The New York Fed Empire State Manufacturing Survey dropped by the most on record to its lowest level since 2016. This is the first in a series of surveys to be released by the regional Federal Reserve Banks over the next two weeks. An index of homebuilder sentiment posted an unexpected drop, with sales expectations hitting a four-month low. Many market watchers and economists like to watch the spread between the yields of the 2- and 10-year Treasury for an indication of potential recession. As seen in the table below, but for a handful of times in the last 30 years, a recorded recession has occurred within about two years of the spread declining to its present level of less than a quarter point.
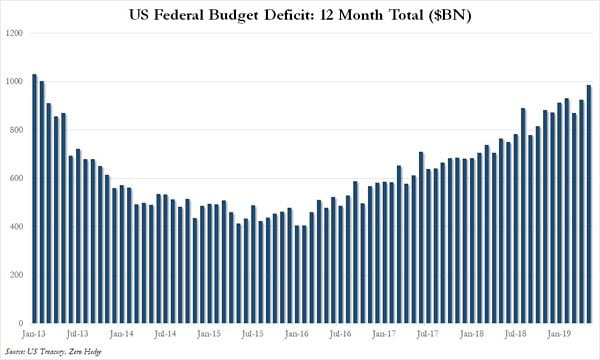
Certainly, the collective feelings of global investors have recently morphed in fairly rapid fashion. The latest Bank of America Merrill Lynch Fund Manager Survey of roughly 180 respondents marked the first time since its inception in 2013 that U.S. Treasuries topped the investor preference list, eclipsing “Technology” as a category. The Survey further showed investors moving to cash and bond allocations at the highest rate since 2011 and global stock positions at their lowest since March of 2009. The move into U.S. Treasuries and the corresponding decline in yields has come at a time of significantly increased U.S. deficits and increased issuance.
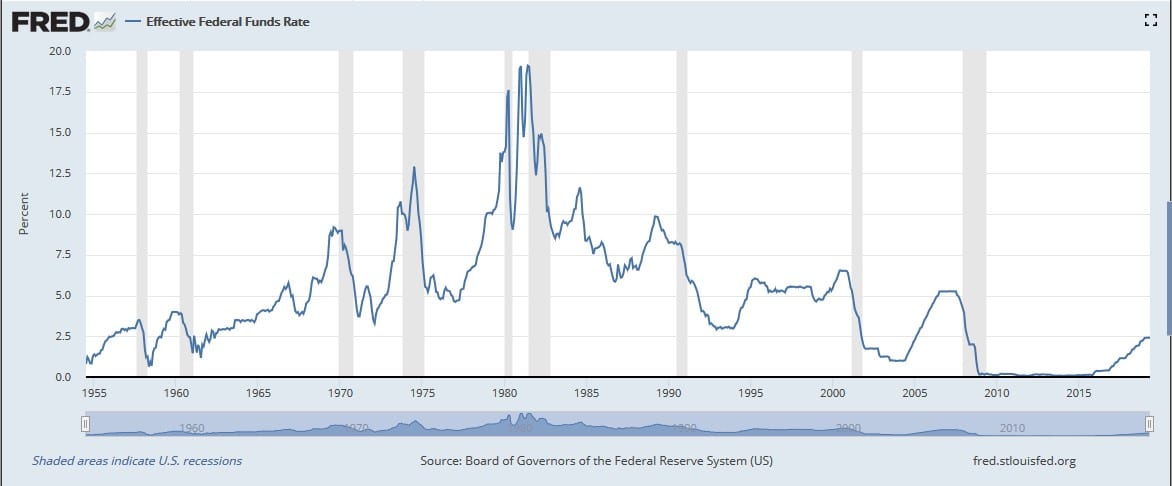
All eyes have now affixed their gaze at the Federal Reserve and other global monetary authorities. The Federal Reserve’s monetary policy body, the Federal Open Market Committee (FOMC), will conclude its June meeting tomorrow. Expectations are for the FOMC to leave the target range for the federal funds rate unchanged at 2.25% – 2.50%. However, the CME’s FedWatch tool is currently pricing a 68% probability of a quarter-point rate cut at the FOMC’s July meeting (up from 23% one month ago) and a 50% chance of another quarter-point cut in September (up from under 10% one month ago). Adjusting the fed funds rate isn’t the only tool at the Fed’s disposal, as it could also adjust its balance sheet strategy, going forward. In any event, the FOMC has not embarked on a series of rate cuts with a peak fed funds rate this low in modern history.
Additionally, most global central bank counterparts have never really shifted to a period of taking their feet off the monetary pedal. There’s not a similar paradigm in the financial playbook to reference back to. Economic uncertainty and its corresponding negative effects could certainly be dealt a tremendous blow should trade tensions ease by way of even a strong inkling of a trade deal with China that has achievable parameters.
MUNI MARKET TRENDS
Muni issuers have enjoyed the benefits of the rate environment described above. Additionally, new issue volume has been favorable during the months of April and May, although year-to-date volume is about on par (pun intended) with 2018. June has seen a bit of an uptick in sales. Last week saw about $10 billion in new issuance, dropping to an expected $8.5 billion this week. Recent weeks have been running around $6 – $7 billion. A report by CreditSights indicates a 30-day net supply (new issues less redemptions) at $36.4 billion, showing likely demand by way of reinvestment outstripping supply. This has been the case for some time.
Given the current absolute level of yields (low) and the current yield curve inversion, we do expect volume to increase, as issuers take advantage of low rates to fund projects and shift variable exposure to fixed rate. We have seen strong dealer interest at competitive sales and investor demand across the credit and maturity spectrum. Bank purchasers also seem to have an increased appetite for municipal credit and tax-exempt income.
Many issuers are reviewing refunding opportunities for currently callable bonds with fairly low coupons that produce marginal savings. We might argue that the current level of estimated savings might be the best you may achieve, as savings tend to diminish for bonds that are callable as you move forward in time. Issuers should consult with their municipal advisor on options for current refundings, including both public and private market transactions, as well as how to structure the transaction to maximize savings.
INVESTMENT TRENDS
The story line is becoming more difficult to follow as new plot twists develop: the threat of tariffs on imported goods from Mexico (since rescinded), rhetoric from Chinese officials that suggests they aren’t going to cave in to U.S. trade deal demands, oil entering a bear market, and incoming data that corroborates the slowing growth narrative.
The real plot twist, though, has been the inversion of the spread between 3-month and 10-year Treasuries, which now sits at -22 basis points and the break below 2.00% for the 2-year Treasury. Additionally, the fed funds futures market isn’t pricing in just one quarter-point rate cut before the end of the year, it’s now pricing in up to three rate cuts. That’s a lot of twists in a span of just a few weeks, yet it goes to show how quickly the capital markets can move when they are not only trend following, but also seeing and hearing things that corroborate the trend.
On May 15, the yield on the 2-yr note stood at 2.16%. Recently, it traded as low as 1.77% after the ADP Employment Change Report indicated only 27,000 positions were added to private-sector payrolls in May. Fed officials are taking notice. How could they not be? Their attention has been geared more toward the downside economic risks posed by the tariffs and protectionist trade policies than it has been specifically to what the fed funds futures market is doing, yet the latter is capturing the concerns about the former. Fed officials can’t ignore it, but to what extent they abide by it — and when — are the $64,000 questions. The current target range for the fed funds rate is 2.25% – 2.50% (with the effective rate being slightly higher than the middle of the range). The ability of the Fed to remain patient is being compromised by the market action, but at the same time, it is perhaps being incentivized by the current Administrations’ approach to trade matters. The Fed may believe it doesn’t have a lot of rate-cut bullets at its disposal, so it is apt to wait and see what unfolds on the trade negotiation front this month before it elects to pull the trigger on the rate cut the market is subconsciously telling the Fed to enact. It’s an “old Jedi mind trick” the market has used in the past with much success, and one that is looking more likely to work again in this latest sequel to the fed funds rate saga.
IMPORTANT INFORMATION: PLEASE READ
The information contained herein reflects, as of the date hereof, the view of Ehlers & Associates, Inc. (or its applicable affiliate providing this publication) (“Ehlers”) and sources believed by Ehlers to be reliable. No representation or warranty is made concerning the accuracy of any data compiled herein. In addition, there can be no guarantee that any projection, forecast or opinion in these materials will be realized. Past performance is neither indicative of, nor a guarantee of, future results. The views expressed herein may change at any time subsequent to the date of publication hereof. These materials are provided for informational purposes only, and under no circumstances may any information contained herein be construed as “advice” within the meaning of Section 15B of the Securities and Exchange Act of 1934, or otherwise relied upon by you in determining a course of action in connection with any current or prospective undertakings relative to any municipal financial product or issuance of municipal securities. Ehlers does not provide tax, legal or accounting advice. You should, in considering these materials, discuss your financial circumstances and needs with professionals in those areas before making any decisions. Any information contained herein may not be construed as any sales or marketing materials in respect of, or an offer or solicitation of municipal advisory service provided by Ehlers, or any affiliate or agent thereof. References to specific issuances of municipal securities or municipal financial products are presented solely in the context of industry analysis and are not to be considered recommendations by Ehlers.