40, 48, 47, 36, 15… No, those are not the winning lottery numbers. Those numbers represent the basis point (1 basis point = 0.01%) increases in U.S. Treasury yields during just the last two weeks for one-, two-, five-, ten- and thirty-year benchmark maturities. In August of 2020, the 10-year Treasury yielded roughly 0.55%. The 2-year Treasury increased in yield by nearly that much in roughly the last ten business days. The magnitude of these interest rate moves has caused fixed-income investors to pause, and some to exit entirely. The table below depicts changes in Treasury yields at the beginning of 2021, end of 2021, and through the end of trading on Tuesday of this week:
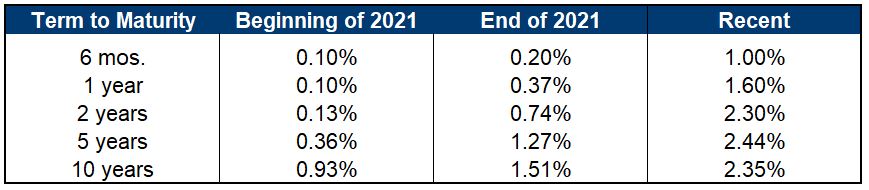
As can be seen, the largest increases have been to yields through about seven years in maturity. The result of the disparity in increases is a much flatter yield curve than what has persisted over a number of years, much of which was characterized by very low short-term rates. The markets have clearly reacted and adjusted to the stated intent of the Federal Reserve to continue its campaign of increases to the fed funds rate and eliminating its asset purchase program. While inflation was a primary driver of increases in yields during much of 2021, investors have shifted their attention to the Fed’s curtailment of monetary accommodation in this calendar year.
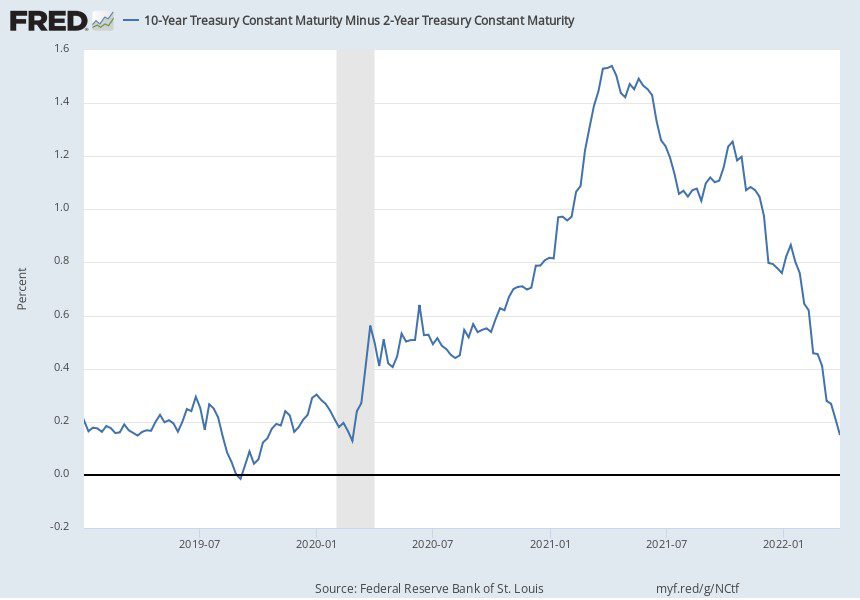
One obvious data point that can be gleaned from the table above is a portion of the yield curve is now inverted, with the 5-year yield exceeding that of the 10-year. The 2-year is encroaching ever closer to the same condition. In fact, the spread between the 2- and 10-year yield is at its tightest since 2020 and was even recently negative on an intraday basis. However, the circumstances surrounding today and 2020 are the opposite of each other. The 10-year yield reached its historic low in 2020, while the 2-year is now increasing in yield to close the gap between the two.
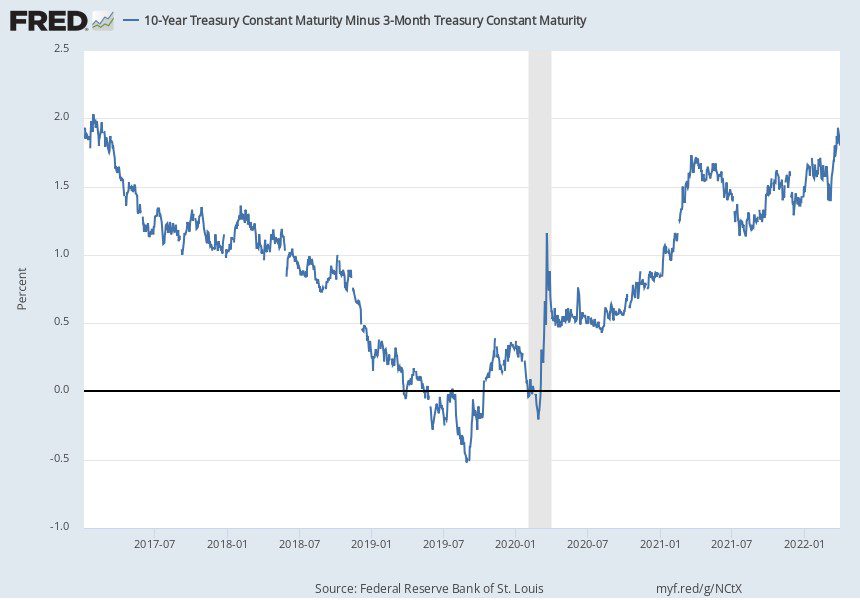
Prognosticators and financial media have begun to ring the alarm about inversion and its potential to portend a recession, with many pointing to the collapse in the difference between the 2- and 10-year yield. In fact, the spread between the 3-month and 10-year yield has proven to be a more reliable harbinger of impending economic decline. That measure happens to be at its highest level since 2017 at nearly 1.90%.
It could take quite some time before the 3mo./10-year spread declines to what some might consider to be emblematic of impending recession. Much of that depends on the Fed’s pace of increase to the fed funds rate and the inflation outlook.
The Federal Open Market Committee (FOMC) next meets in early May. Market expectations implied by the CME’s FedWatch Tool, which is based on probabilities derived from fed funds futures pricing, speak to a 33% chance of a quarter-point increase and a 66% chance of a half-point increase. Recent comments from Fed officials might indicate a more aggressive posture, but only time – and economic data – will tell. It’s not hard to infer the market thinks the Fed is behind the curve, but the Fed now must walk a monetary policy tight rope in a stiff wind from multiple directions.
Recent increases in rates have damaged the bond market, with broad measures of performance based on the most widely followed bond indices showing some of the worst performance on record through the end of the first quarter of 2022. While rates remain low, historically, the surge higher in rates hurts bond prices.
Municipal Market
Munis have not been immune. Yields are up in a similar fashion to Treasuries, in some cases a bit more.
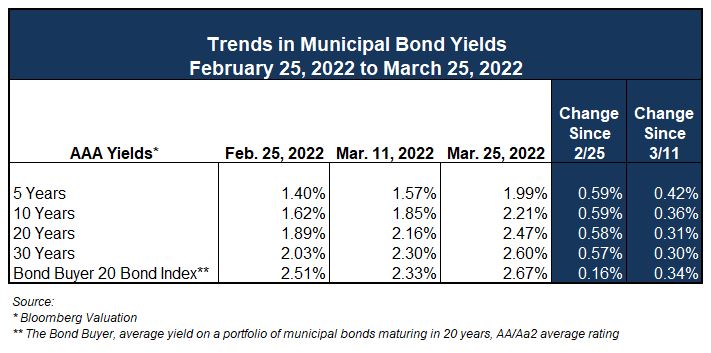
According to Bloomberg indexes, the muni market has produced a negative return of roughly 5.50% for the first quarter of this year, its worst since 1994. This has resulted in investor redemption of municipal bond mutual funds since the middle of January. The Investment Company Institute reports that muni mutual fund outflows year-to-date have reached nearly $24 billion. That exceeds the amount of outflows for all of 2022. Fund outflows have been negative the last ten weeks, with only the first two weeks of the year experiencing inflows.
Mutual fund managers have had to sell bonds from their portfolios to meet redemptions, putting pressure on bond prices in both the secondary and primary markets. The Bond Buyer recently reported that “bids wanted” by institutional managers was recently as high as $6.3 billion, roughly double the 52-week average. To put this in perspective, that is slightly less than the average new issue volume for a week. When this sort of situation presents itself the primary, or new issue, market tends to be weak. In fact, The Bond Buyer quoted a trader stating, “It has been a challenge to get new issues prices and sold…” Bids wanted lists will need to be worked off for the market to find its footing. April tends to be a bit weaker for financial markets in general, with cash needed for tax payments, but June presents a strong “reinvestment” period where bond coupon and redemption payments are put back into the market. Higher yields should help put a bid under bonds.
Municipals have also “cheapened” in relation to Treasuries with tax-exempt to taxable yield ratios increasing recently. The ratios at 5-, 10- and 30-years are now 80%, 92% and 102%, respectively. This will similarly draw the attention of buyers, as higher ratios increase the value of the tax-exemption.
There are always occasions where volatility and uncertainty reintroduce themselves. The fact remains that rates are still historically low. In nearly all circumstances, a well-crafted finance plan will overcome higher interest rates. Your finance team can assist you in building a durable strategy to achieve your objectives.
Required Disclosures: Please Read
Ehlers is the joint marketing name of the following affiliated businesses (collectively, the “Affiliates”): Ehlers & Associates, Inc. (“EA”), a municipal advisor registered with the Municipal Securities Rulemaking Board (“MSRB”) and the Securities and Exchange Commission (“SEC”); Ehlers Investment Partners, LLC (“EIP”), an investment adviser registered with the SEC; and Bond Trust Services Corporation (“BTS”), holder of a limited banking charter issued by the State of Minnesota.
This communication does not constitute an offer or solicitation for the purchase or sale of any investment (including without limitation, any municipal financial product, municipal security, or other security) or agreement with respect to any investment strategy or program. This communication is offered without charge to clients, friends, and prospective clients of the Affiliates as a source of general information about the services Ehlers provides. This communication is neither advice nor a recommendation by any Affiliate to any person with respect to any municipal financial product, municipal security, or other security, as such terms are defined pursuant to Section 15B of the Exchange Act of 1934 and rules of the MSRB. This communication does not constitute investment advice by any Affiliate that purports to meet the objectives or needs of any person pursuant to the Investment Advisers Act of 1940 or applicable state law. In providing this information, The Affiliates are not acting as an advisor to you and do not owe you a fiduciary duty pursuant to Section 15B of the Securities Exchange Act of 1934. You should discuss the information contained herein with any and all internal or external advisors and experts you deem appropriate before acting on the information.