Weakness in the global economy as well as worries about low inflation are driving much of the conversation about rate cutting at the Fed lately. After our last commentary, minutes from the June meeting of the Federal Open Market Committee (FOMC) were released. As The New York Times reports, the group in charge of setting the target rate for fed funds decided to leave the range unchanged at 2.25 – 2.50%. This is not a surprise when considering some of the more positive data coming out of the U.S. economy lately (record low unemployment, record high stock market growth). However, for the first time since Jerome Powell became Chair of the Federal Reserve in 2018, there was a dissenting vote, as well as numerous negative comments from non-voting members regarding the FOMC’s direction.
In a blog post, non-voting FOMC member Neel Kashkari states that he advocated for a 50 basis point decrease to the fed funds target rate because he believes it would help to address an inflation rate that has been persistently below the Fed’s target.
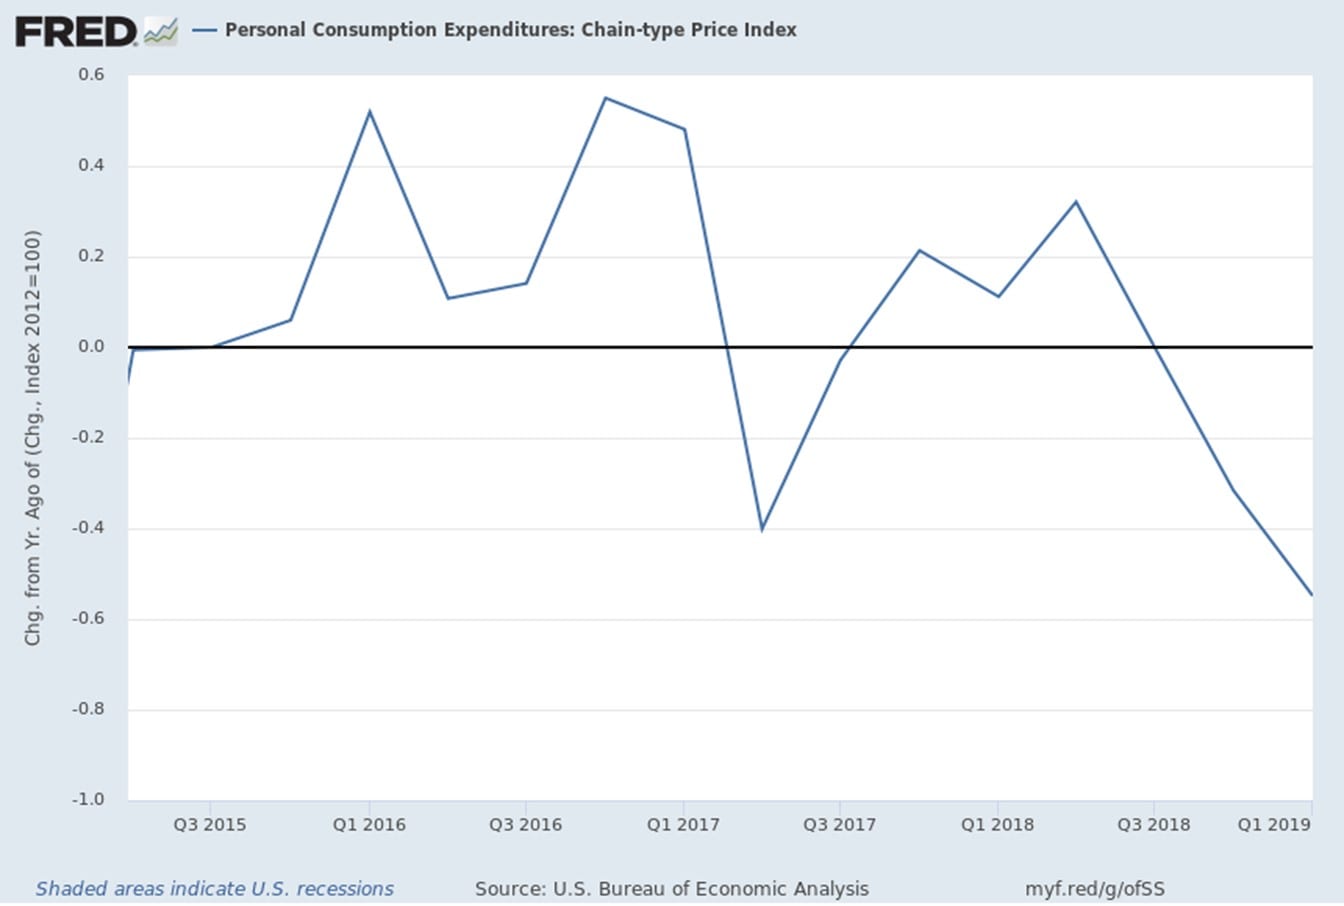
The chart (above) shows the recent annualized change in one of the Fed’s preferred inflation measures, the chain-weighted Personal Consumption Expenditures (PCE). Kashkari argues that the recent mixed economic performance and inverted yield curve (which we detailed last week) are adding to overall downward pressure on inflation. As such, a rate decrease now would allow the Fed to be proactive about reaching inflation targets ahead of any potential global economic downturns. According to The New York Times, dissenting voter James Bullard agrees with Kashkari’s position.
Sources:
https://www.nytimes.com/2019/06/21/business/economy/fed-trump-interest-rates.html
https://medium.com/@neelkashkari/a-strategy-to-re-anchor-inflation-expectations-8d2fe830f7ba
Legislation to Expand Bank Qualification to be Introduced
Rep. Terri Sewell (D-AL) and Rep. Tom Reed (R-NY), members of the House Ways and Means Committee, which oversees tax policy, will co-sponsor new legislation to be introduced in the House of Representatives on July 10th, according to The Bond Buyer. Their anticipated bill would increase the amount of bank-qualified debt for governmental issuers from $10 million to $30 million in a calendar year.
Being able to designate tax-exempt obligations as bank-qualified (BQ) has historically led to lower rates because it affords banks preferential tax treatment related to purchasing these types of obligations, thus incentivizing them to purchase and hold BQ debt. This greater pool of investors is good for small, infrequent issuers who may historically receive little attention in the municipal market. The “spread” in yields between BQ obligations and “non-BQ” obligations of the same maturity and credit quality can be as large as 0.50% but varies based on market conditions.
The BQ limit has been locked-in at the $10 million limit since 1986 with the exception of 2009-2010 when the American Recovery and Reinvestment Act (ARRA) temporarily increased it to $30 million. During this time, an influx of smaller issuers were able to take advantage of the new eligibility and lower their borrowing costs. The hope, for Reps. Sewell and Reed, is that this legislation would help to bolster small government issuers who want to be able to issue tax-exempt municipal bonds at the lowest possible cost of capital. We will note, however, that when the BQ limit was increased in 2009-10, the spread in yields between BQ and non-BQ debt seemed to narrow, likely due to the larger than normal supply of BQ debt.
The bipartisan nature of the proposed legislation certainly bodes well for its upcoming deliberation, as does the fact that other members of Congress have brought forward similar legislation at various times in the past. Perhaps this time it will have the needed support.
Investment Trends
If two is company and three’s a crowd, what do thousands of people make? The simple answer is that they make a much larger crowd. Simpler yet, the Treasury market knows a thing or two about large crowds. Investors have gathered en masse to buy U.S. Treasuries, sending yields sharply lower across the curve. The pressing question is why? Several popular answers include the following:
- Inflation rates are subdued, and inflation expectations are slipping
- Treasuries provide relative value versus negative-yielding sovereign securities in Japan and Europe
- Late-cycle worries have fueled an increase in capital preservation investment strategies
- Worries about the economic impact of protectionist trade actions have fostered a rotation into safe-haven instruments
- The Federal Reserve is presumably on the cusp of a rate-cut cycle
We suppose you could add “momentum” to the list, as the Treasury trade has been full of momentum since late last year when recession concerns escalated prior to the FOMC’s December 2018 rate hike.
Might that momentum be ready to turn? Let’s take a closer look at positioning.
According to the latest Bank of America/Merrill Lynch Global Fund Manager Survey, being long US Treasuries has been identified as the most “crowded trade,” overtaking long US tech stocks. In fact, it is the first time ever that long US Treasuries has earned the distinction of being the most crowded trade.
The “crowded trade” idea isn’t new, even if the revelation is that long US Treasuries is the most crowded trade. Why, then, do Treasury yields keep falling? We suspect it has a lot to do with the fact that bond yields in other developed countries keep sinking.
The 10-yr yield in the UK is 0.81%; the 10-yr yield in Japan is negative 0.17%; and the 10-yr yield in Germany is negative 0.32%. Stunningly, there are $12.5 trillion of negative-yielding bonds, according to Bloomberg data cited by FT. For many bond investors, then, even 1.98% on a 10-yr Treasury note looks like a gift.
Anyhow, when things get crowded in a crowded room, you often need to open the windows, or a door, to let some air in. That could soon happen in the Treasury market, particularly if the Trump-Xi meeting at the G-20 Summit at the end of June goes well.
If that meeting doesn’t go well, then the crowd will probably continue since it will invite an assumption that global growth is set to slow further, prompting central banks to act more quickly — and maybe more aggressively — to keep disinflationary forces in check.
The slope of the Treasury yield curve steepened slightly last week, as the 2-yr to10-yr spread widened by a basis point to 25 bps while the 2-yr to 30-yr spread widened by two basis points to 75 bps.
The recent steepening is consistent with what was seen during the Fed’s last easing cycle that began after the financial crisis when the market expressed belief that easing efforts will boost growth and inflation in the future. This time around, the long end is steepening as the market prices in expectations for a growing number of rate cuts in the near future.
As such, rate cut expectations have increased once again. The fed funds futures market sees an 85.5% implied likelihood of a quarter-point rate cut in July, up from last week’s 84.3%. The fed funds futures market generally expects that a July cut will be followed by a quarter-point rate cut in September (66.0%), and another quarter-point in January (62.3%).
Ehlers Investment Partners does not believe in timing investments as interest rates fluctuate. With a comprehensive cash flow forecast as a guide, Ehlers Investment Partners believes a properly laddered portfolio structure will meet or exceed all the investment objectives as outlined in an investment policy. Additionally, a laddered structure will allow for taking advantage of rising interest rates as maturing investments will be reinvested at higher rates and falling rates will not have a significant impact on overall portfolio performance.
IMPORTANT INFORMATION: PLEASE READ
The information contained herein reflects, as of the date hereof, the view of Ehlers & Associates, Inc. (or its applicable affiliate providing this publication) (“Ehlers”) and sources believed by Ehlers to be reliable. No representation or warranty is made concerning the accuracy of any data compiled herein. In addition, there can be no guarantee that any projection, forecast or opinion in these materials will be realized. Past performance is neither indicative of, nor a guarantee of, future results. The views expressed herein may change at any time subsequent to the date of publication hereof. These materials are provided for informational purposes only, and under no circumstances may any information contained herein be construed as “advice” within the meaning of Section 15B of the Securities and Exchange Act of 1934, or otherwise relied upon by you in determining a course of action in connection with any current or prospective undertakings relative to any municipal financial product or issuance of municipal securities. Ehlers does not provide tax, legal or accounting advice. You should, in considering these materials, discuss your financial circumstances and needs with professionals in those areas before making any decisions. Any information contained herein may not be construed as any sales or marketing materials in respect of, or an offer or solicitation of municipal advisory service provided by Ehlers, or any affiliate or agent thereof. References to specific issuances of municipal securities or municipal financial products are presented solely in the context of industry analysis and are not to be considered recommendations by Ehlers.